Inductance and capacitance reactances
Inductance is the ability of a body to accumulate energy in a magnetic field. It is characterized by a phase lag between the current and the voltage. Typical inductive elements are chokes, coils, transformers, electric motors.
Capacitance refers to elements that accumulate energy using an electric field. Capacitive elements are characterized by a phase lag between voltage and current. Capacitive elements: capacitors, varicaps.
Their main properties are given; the nuances are not taken into account within the scope of this article.
In addition to the listed elements, others also have a certain inductance and capacitance, for example in electrical cables distributed along its length.
Capacitance and inductance in an alternating current circuit
If in direct current circuits capacitance in the general sense represents an open section of the circuit, and inductance is a conductor, then in alternating current circuits capacitors and coils are a reactive analogue of a resistor.
The reactance of the inductor is determined by the formula:
Vector diagram:
Capacitor reactance:
Here w is the angular frequency, f is the frequency in the sinusoidal current circuit, L is the inductance, C is the capacitance.
Vector diagram:
It is worth noting that when calculating reactive elements connected in series, the formula is used:
Please note that the capacitive component is taken with a minus sign. If there is also an active component (resistor) in the circuit, then add it according to the formula of the Pythagorean theorem (based on the vector diagram):
What does reactance depend on? Reactive characteristics depend on the value of capacitance or inductance, as well as on the frequency of the alternating current.
If you look at the formula for the reactive component, you will notice that at certain values of the capacitive or inductive component, their difference will be equal to zero, then only active resistance will remain in the circuit. But these are not all the features of this situation.
Types of vector diagrams
Vector graphics are well suited for correctly displaying variables that determine the functionality of radio devices. This implies a corresponding change in the basic parameters of the signal along a standard sinusoidal (cosine) curve. To visualize the process, harmonic oscillation is represented as a projection of a vector onto the coordinate axis.
Using standard formulas, it is easy to calculate the length, which will be equal to the amplitude at a certain point in time. The tilt angle will indicate the phase. The total influences and corresponding changes in vectors obey the usual rules of geometry.
There are high-quality and accurate diagrams. The first ones are used to take into account mutual connections. They help make a preliminary assessment or are used to completely replace calculations. Others create taking into account the results obtained, which determine the size and direction of individual vectors.
Pie chart
Let us assume that we need to study the change in current parameters in a circuit for different values of resistor resistance in the range from zero to infinity. In this circuit, the output voltage (U) will be equal to the sum of the values (UR and UL) on each of the elements. The inductive nature of the second quantity implies a perpendicular relative position, which is clearly visible in part of figure b). The triangles formed fit perfectly into the 180 degree circle segment. This curve corresponds to all possible points through which the end of the vector UR passes with a corresponding change in electrical resistance. The second diagram c) shows a current lag in phase by an angle of 90°.
Line chart
Shown here is a two-pole element with active and reactive conductivity components (G and jB, respectively). A classic oscillatory circuit created using a parallel circuit has similar parameters. The parameters noted above can be represented by vectors that are constantly located at an angle of 90°. A change in the reactive component is accompanied by a movement of the current vector (I1...I3). The formed line is located perpendicular to U and at a distance Ia from the zero point of the coordinate axis.
Mechanics; harmonic oscillator
- A harmonic oscillator in mechanics and a harmonic oscillator of any nature formally represent an exact analogy, so we will consider them in one paragraph using the example of a mechanical harmonic oscillator.
- The use of vector diagrams in mechanics is reduced mainly to the case of a harmonic oscillator (including the case of an oscillator with a friction force linear in speed); however, vector diagrams can be to some extent useful for studying several oscillators, including in the limit of an infinite number of them (for oscillations or waves in distributed systems).
- From a modern point of view, the application of vector diagrams to a harmonic oscillator is rather of only historical and pedagogical interest, but nevertheless, in principle, they are quite applicable here.
- In mechanics, the use of vector diagrams (usually meaning their application to a one-dimensional oscillator) has the peculiarity that the addition of a second coordinate to transform oscillations into rotation can have not only a purely formal abstract meaning, but for a one-dimensional mechanical system of this kind a mechanical two-dimensional system can be indicated , for which the vector diagram is the first to be realized as a completely real two-dimensional mechanical movement, and all vectors are really two-dimensional (and after projecting all of them and moving a point of a two-dimensional system onto one axis, we obtain instantaneous values of the corresponding quantities - including positions - for the corresponding one-dimensional system ); Thus, for a mechanical one-dimensional system, not only a formal mathematical, but also a real mechanical model is possible, transforming oscillatory one-dimensional motion into rotational motion in two-dimensional space, implementing a vector diagram for a one-dimensional system.
Let us examine two main cases of simple application of vector diagrams in mechanics (as noted above, also applicable to a harmonic oscillator not only of mechanical, but of any nature): an oscillator without damping and without external force and an oscillator with (linear) damping (viscosity) and external forcing by force.
It will be interesting➡ The principle of operation of an electromagnet
A vector diagram is a convenient tool for representing sinusoidal functions of time, which are, for example, voltages and currents of an alternating current electrical circuit.
Consider, for example, an arbitrary current represented as a sine function
i(t) = 10 sin(ωt + 30°).
This sinusoidal signal can be represented as a complex quantity
I = 10∠30°.
To form a complex number, the magnitude and phase of the sinusoidal signal are used.
To construct vector diagrams, first compose equations according to Kirchhoff's laws for the electrical circuit in question.
Let's consider the electrical circuit shown in Fig. 1, and draw a vector voltage diagram for it. Let us denote the voltage drop across the elements.
Series connection of circuit elements
Let's create an equation for this chain according to Kirchhoff's second law:
UR + UL + UC = E.
According to Ohm's law, the voltage drop across the elements is determined by the following expressions:
UR = I ∙ R,
UL = I ∙ jXL,
UC = −I ∙ jXC.
To construct a vector diagram, it is necessary to display the terms given in the equation on the complex plane. Typically, current and voltage vectors are displayed on their own scales: separately for voltages and separately for currents.
From the mathematics course we know that j = 1∠90°, −j = 1∠−90°. Hence, when constructing a vector diagram, multiplying a vector by an imaginary unit j results in a rotation of this vector by 90 degrees counterclockwise, and multiplication by −j results in a rotation of this vector by 90 degrees clockwise.
When constructing a vector diagram of voltages on the complex plane, we will first display the current vector I, after which we will display the voltage drop vectors relative to it (Fig. 2), taking into account the above relations for the imaginary unit.
The voltage drop across the resistor UR coincides in direction with the current I (since UR = I ∙ R, and R is a purely real value or, in simple words, there is no multiplication by an imaginary unit). The voltage drop across the inductive reactance leads the current vector by 90° (since UL = I ∙ jXL, and multiplying by j leads to a rotation of this vector by 90° counterclockwise). The voltage drop across the capacitive reactance lags behind the current vector by 90° (since UC = −I ∙ jXC, and multiplying by −j leads to a rotation of this vector by 90° clockwise).
Vector diagram of voltages for series connection of circuit elements
It should be noted that one vector diagram shows only vectors of those quantities whose frequency coincides!
Let's consider the electrical circuit shown in Fig. 3, and draw a vector diagram of currents for it. Let us denote the direction of the currents in the branches.
Parallel connection of circuit elements
Let's create an equation for this chain according to Kirchhoff's first law:
I – IR – IL – IC = 0,
where
I = IR + IL + IC.
Let us determine the currents in the branches according to Ohm’s law using the following expressions, taking into account that 1 / j = −j:
IR = E/R,
IL = E / (jXL) = −j ∙ E / XL,
IC = E / (−jXC) = j ∙ E / XC,
To construct a vector diagram, it is necessary to display the terms given in the equation on the complex plane.
When constructing a vector diagram of currents on the complex plane, we will first display the EMF vector E, after which we will display the current vectors relative to it (Fig. 4), taking into account the above relations for the imaginary unit.
The current in the resistor IR coincides in direction with the emf E (since IR = E / R, and R is a purely real quantity or, in simple words, there is no multiplication by an imaginary unit). The current in the inductive reactance lags behind the EMF vector by 90° (since IL = −j ∙ E / XL, and multiplying by −j results in a rotation of this vector by 90° clockwise). The current in the capacitive reactance leads the EMF vector by 90° (since IC = j ∙ E / XC, and multiplying by j leads to a rotation of this vector by 90° counterclockwise). The resulting current vector is determined after the geometric addition of all vectors according to the parallelogram rule.
Vector diagram of currents for parallel connection of circuit elements
For an arbitrary circuit, the algorithm for constructing vector diagrams is similar to the above, taking into account the currents flowing in the branches and the applied voltages.
Please note that the site provides a tool for constructing vector diagrams online for three-phase circuits.
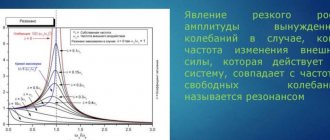
Voltage resonance
If a capacitor and an inductor are connected in series with the generator, then, provided their reactances are equal, voltage resonance will occur. In this case, the active part Z should be as small as possible.
It is worth noting that inductance and capacitance only have reactive qualities in idealized examples. In real circuits and elements, there is always active resistance of the conductors, although it is extremely small.
At resonance, energy is exchanged between the inductor and the capacitor. In ideal examples, when the energy source (generator) is initially connected, energy is stored in the capacitor (or inductor) and after it is turned off, continuous oscillations occur due to this exchange.
The voltages across the inductance and capacitance are approximately the same, according to Ohm's law:
U=I/X
Where X is Xc capacitive or XL inductive reactance, respectively.
A circuit consisting of inductance and capacitance is called an oscillatory circuit. Its frequency is calculated by the formula:
The period of oscillation is determined by the Thompson formula:
Since reactance depends on frequency, the inductance resistance increases with increasing frequency, while that of the capacitance decreases. When the resistances are equal, the total resistance is greatly reduced, as shown in the graph:
The main characteristics of the circuit are quality factor (Q) and frequency. If we consider the circuit as a four-terminal network, then its transmission coefficient after simple calculations is reduced to the quality factor:
K=Q
And the voltage at the circuit terminals increases in proportion to the transmission coefficient (quality factor) of the circuit.
Uk=Uin*Q
With voltage resonance, the higher the quality factor, the more the voltage on the circuit elements will exceed the voltage of the connected generator. The voltage can increase tens or hundreds of times. This is shown in the graph:
Power losses in the circuit are caused only by the presence of active resistance. Energy is taken from the power source only to maintain oscillations.
The power factor will be equal to:
cosФ=1
This formula shows that losses occur due to active power:
S=P/Cosф
Reasons for resonance
Voltage resonance appears in the case of a series connection of sections containing inductive and capacitive resistances, as well as resistors. Such a simple circuit is often called a series or parallel circuit.
The presence of resistive resistance is not necessary in the resonant circuit. However, it must be taken into account when determining the resistance of conductors. Thus, the resonant mode completely depends on the parameters and properties of the electrical circuit. It is not affected in any way by external sources of electrical energy.
In order to determine the conditions under which the resonance mode occurs, it is necessary to test the electrical circuit to determine its conductivity or complex resistance. In addition, its imaginary part must be isolated and set equal to zero.
Current resonance
Current resonance is observed in circuits where inductance and capacitance are connected in parallel.
The phenomenon consists of the flow of large currents between the capacitor and the coil, with zero current in the unbranched part of the circuit. This is explained by the fact that when the resonant frequency is reached, the total resistance Z increases. Or in simple terms it sounds like this - at the resonance point the maximum total value of resistance Z is reached, after which one of the resistances increases and the other decreases, depending on whether the frequency increases or decreases. This is clearly shown in the graph:
In general, everything is similar to the previous phenomenon; the conditions for the occurrence of current resonance are as follows:
- The supply frequency is similar to the resonant frequency of the circuit.
- The conductivities of inductance and capacitance for alternating current are equal to BL=Bc, B=1/X.
Application in practice
Let's consider the benefits and harms of resonance of currents and voltages. The resonance phenomenon has brought the greatest benefit to radio transmitting equipment. In simple words, the receiver circuit has a coil and a capacitor connected to the antenna. By changing the inductance (for example, by moving the core) or the capacitance value (for example, with an air variable capacitor), you tune the resonant frequency. As a result, the voltage on the coil increases and the receiver catches a certain radio wave.
These phenomena can cause harm in electrical engineering, for example, on cable lines. The cable represents inductance and capacitance distributed along its length if voltage is applied to the long line in no-load mode (when there is no load connected at the end of the cable opposite the power source). Therefore, there is a danger that an insulation breakdown will occur; to avoid this, a load ballast is connected. Also, a similar situation can lead to failure of electronic components, measuring instruments and other electrical equipment - these are dangerous consequences of this phenomenon.
How to construct a vector diagram of currents and voltages
Calculations in circuits with sinusoidal voltages and currents are simplified if, instead of sinusoids, we operate with their images - rotating vectors (Fig. 1).
The projection of the end of the vector onto the coordinate axis performs sinusoidal oscillations: each instantaneous current value corresponding to the instant of time and phase angle can be considered as a projection onto the ordinate axis of a vector rotated by a phase angle relative to the abscissa axis.
| If something is unclear, you can always write to me on WhatsApp and I will help you! |
Thus, a sinusoidal function is conventionally represented by a vector, the length of which is determined by its maximum or effective value, and the direction by its initial phase; the positive initial phase is deposited from the horizontal axis in the direction of rotation of the vectors (counterclockwise). Vectors of currents and voltages, rotating with the same
angular velocity. motionless relative to each other. The conditional representation of currents and voltages sinusoidally varying in time using vectors made it possible to write Kirchhoff's first and second laws in vector form.
Algebraic summation of sinusoids, i.e. the summation of their instantaneous values corresponds to geometric actions on the vectors representing them. The application of Kirchhoff's laws in this form will make it possible to calculate electrical circuits quite simply and clearly by constructing vector diagrams. When starting a graphical calculation of alternating current penalties, it should be remembered that the physical processes in the sections of the circuit with resistance, inductance, and capacitance are very different.
It will be interesting➡ Inductive reactance
Accordingly, the current vector and voltage vector have the same direction.
In an inductive element, the current lags behind the voltage by and the vectors are located accordingly (Fig. 3). Ohm's law for a section of a circuit with only inductive reactance is written.
In a capacitive element in active resistance, the current and voltage are in phase (Fig. 2), the current leads the voltage by (the location of the voltage and current vector is shown in Fig. 4); Ohm's law for a section of a circuit with only capacitance is written or
Let's consider the calculation of branched electrical circuits using vector diagrams.
Graphic-analytical calculation method
The graphoanalytical calculation method is a combination of the graphical method and the method of proportional recalculation. The method is based on the fact that in a linear circuit, currents are proportional to voltages; a vector diagram of voltages and currents, calculated and constructed for one value of the voltage supplying the circuit, will retain its appearance when the value of this voltage changes; in this case, only the scales of voltages and currents on the diagram will change.
For the circuit (Fig. 5) the parameters are known
It is required to determine the effective value of branch currents, voltages in sections of the circuit, and the initial phases of currents and voltages.
The construction of a vector diagram begins with the most distant source of the circuit element, as they say, from the “end” of the circuit. We accept scales for current and voltage. We set the value of the current in the branch, determine and plot the voltage in the sections of the branch on the diagram.
The voltage drop across the capacitance is equal in magnitude and is 90° out of phase with the current (vector in the diagram).
The voltage drop is equal in magnitude and in phase with the current. We orient the voltage vector in the diagram relative to the current. The sum of the vectors determines the voltage in the section. From the scale diagram we determine the voltage value. Next, we use Ohm's law for the section of the circuit with resistance, find the current, since then.
For the node, the equation according to Kirchhoff’s first law will be written:
Having determined the magnitude of the current, we will construct a vector, taking the horses of the current vector as the beginning of the construction. The current vector is constructed at an angle to the voltage vector - in the direction of the lag, since the current is the current through the inductive element, it will thaw from the voltage by . The sum of the current vectors gives the vector - the current in the common branch of the circuit, it is equal (taken to scale from the diagram).
Let's write down and graphically solve the equation using Kirchhoff's second law for the contour.
Let's move on to constructing this equation. Let's take the end of the vector as the beginning of constructing the voltage vector - the voltage drop across the inductive reactance. The vector of this voltage is ahead of the current in phase by , so we construct it.
We take the end of the vector as the beginning of constructing the voltage vector across the active resistance. The magnitude of the voltage, the voltage vector is in phase with the current, we build it parallel to the current vector. We take the end of the vector as the beginning of the construction of the vector - the voltage across the capacitive reactance, the vector lags behind the current vector.
If we now connect the origin of coordinates (point with the end of the vector (point “a” of the voltage diagram), we obtain a voltage vector applied to the circuit equal to 15V (from the voltage scale). If the voltage applied to the circuit has a different value, for example, 90 V. then due to the linearity of Kirchhoff's laws, all currents and voltage drops will increase by a factor of , where , but the relative position of the vector on the diagram will not change.
The input voltage has an initial phase, take this into account and construct the axis of reference for the angles of the initial phases. We draw a ray from the beginning of the construction to the voltage vector (a point at an angle , the ray will be the axis of reference for the angles of the initial phases of all currents and voltages.
Using a vector diagram, you can record the instantaneous values of all calculated quantities. For example, the current in the second branch:
Section voltage, etc.
A stress vector diagram constructed in this sequence is called topographic.
Topographic diagram
Topographic diagrams are diagrams of complex potentials, with each point in the diagram corresponding to a specific point on the topographic diagram.
The topographic diagram allows you to measure the magnitude and initial phase of the voltage of any section of the circuit that is not involved in the calculation. For example,
The effective value of the voltage between the points and the circuit and the initial phase. Then
Let's consider an example of constructing a topographic diagram on a complex plane.
The circuit is given (Fig. 7), its parameters:
Using a complex method, we calculate the circuit currents:
We construct a scaled current diagram on the vector plane (Fig. 8). To construct a topographic stress diagram, we take the node potential equal to zero, .
Then the point will be at the origin of the complex plane. Let us calculate the voltage complexes on each of the elements of the circuit, bypassing the circuit from the point against the direction of the current. With this bypass direction, the voltage across the resistance
We construct a vector on the complex plane (Fig. 8).
From a point at an angle to the real semi-axis +1 we plot the module on a scale. The vertex of the constructed vector corresponds to the point. The vector arrow should be directed to a point, i.e., opposite to the direction of the voltage arrow on the circuit diagram, topographic diagram, the vector should be 90° ahead of the phase of the current vector. Find the voltage across the resistance:
Using the resulting expression, we construct a vector from a point. The vertex of the vector is the point.
Construction control: the vector must be in phase with the current vector. Now we find the voltage across the inductance:
We construct a vector from a point. The vertex of the constructed vector is the point.
Construction control: the vector must be ahead in phase of the current vector by . Moving along the contour in the chosen direction, we successively find the position of the points on the complex plane. The vector connecting the origin and the point. represents the emf of the source.
Using a topographic diagram, it is easy to determine the voltages between any points in the circuit. For example, the voltage complex is determined by a vector connecting the points and and directed to the point (shown in Fig. 8 by the dotted line). By measuring the magnitude and initial phase of the vector on the diagram, we find .
PrimsrZ. Let's consider the calculation of the circuit in Fig. 7 using the graphic-analytical method
Let's set the conditional value of the current
It will be interesting➡ What types of electrical insulators are there and what are they intended for?
, let . We plot the current value on a scale, assuming that the point is at the origin of coordinates. The selected conditional current value uniquely corresponds to the conditional values of all other currents and voltages in the circuit. We label these voltages and currents with a “prime” label. Finding the voltage
On a scale, we construct a voltage vector that is in phase with the current vector (Fig. 9).
Having calculated the voltage, we construct a voltage vector that is 90′ ahead of the current vector in phase. By connecting the points and , we get the vector . Measuring its length with a ruler, taking into account the scale of stress, we find. Using Ohm's law we find the current
From the end of the current vector we construct a current vector that is ahead of the voltage vector in phase by . Vector summing the currents and finding the current. By measuring the length of the current vector with a ruler, we find . Knowing the currents, we calculate the voltages.
Fig.9
From the point we construct a voltage vector that is lagging in phase with the current and a voltage vector that is in phase with the current. To determine the currents for a section of the circuit, we will construct an additional vector diagram. Let
Then
Taking into account the phase relationships between current and voltage, we construct a diagram (Fig. 10). By measuring the length of the vector, taking into account the scale of stress, we find its value. Then the current value is determined as follows.
By constructing a vector and summing the current vectors and , from the diagram in Fig. We find 10.
To bring the diagram in Fig. 10 into line with the previously found current values, we find the conversion factor
Multiplying the lengths of all vectors in Fig. 10 by a coefficient and keeping the phase angles constant, we obtain a vector diagram of the section corresponding to the current.
We measure the angle on the diagram in Fig. 10:
At an angle with respect to the vector in Fig. 9, we construct a vector from a point. Let's now find the voltage:
Since the voltage is 90° ahead of the current in phase. then the vector is constructed as shown in Fig.9. Connecting the dots we get a vector. By measuring its length we find
The vector diagram in Fig. 9 is also a topographic diagram. EMF exceeds EMF by a factor of:
Since the circuit being calculated is linear, the voltages and currents caused by the EMF also exceed the conventional voltages and currents by a factor of = 3.4.
Thus
To measure the initial phases of currents and voltages, in Fig. 9 you should select a coordinate system in which the EMF has an initial phase corresponding to the task. Since , then by placing the origin of coordinates at point , we align the real semi-axis with the direction of the emf, and construct the semi-axis orthogonal to the 4 1 axis, as shown in Fig. 9.
Let's consider an example of constructing a vector diagram using known currents and voltages (the effective values of voltages and currents were obtained experimentally). In this case, using a vector diagram, you can solve the inverse problem of calculating the circuit: but using the currents and voltages of the circuit, determine the equivalent parameters of the two-terminal networks that make up the circuit.