What is an oscilloscope
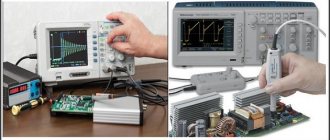
An oscilloscope allows you to visually study the characteristics of complex signals and calculate time and amplitude parameters. Analogue models display data in real time, while modern digital models allow archiving information and analyzing it. To compare signals, devices with several information inputs are used. Depending on the tasks being solved, there are modifications in the form of attachments to a computer or combined with other measuring equipment.
Short story
The history of the oscilloscope goes back more than 100 years. At different times, such famous people as Adre Blondel, Robert Andreevich Colley, William Crookes, Karl Brown, I. Zenneck, A. Wenelt, Leonid Isaakovich Mandelstam and many others worked on improving the device.
By the way, did you know that the first semblance of an oscilloscope was created in the Russian Empire? This was done in 1885 by Russian physicist Robert Colley. The device was called an oscillometer. The oscilloscopes of that time were very different from those used today!
Main settings
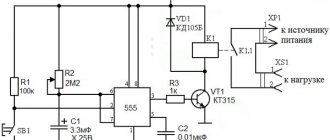
Programmable thermostat W1209
To select an oscilloscope, it is recommended to correctly evaluate the following characteristics:
- to eliminate distortion when working with several high-frequency signals, you should purchase a two- or multi-beam device;
- in different models the error is 5-15%, so limited measurement accuracy should be taken into account;
- digital devices are equipped with color screens, various synchronization devices, and additional service modes;
- The functionality of analog devices is more modest, but they are cheaper;
- the limited capabilities of amplitude-frequency converters make it difficult for high-quality digital electronics to process high-frequency signals;
- Freeze mode with zoom function will help you study the smallest details of complex images.
Before a detailed analysis, you need to clarify what exactly the device is intended for. Next, compliance is assessed according to the following parameters:
- bandwidth;
- frequency range;
- input impedance;
- permissible amplitude values (variable and constant components);
- measurement error;
- isolation between channels;
- internal memory capacity (digital technology).
Design and principle of operation of the device
Let us explain the structure of an analog oscilloscope simply, “for dummies.” The device consists of the following elements:
- ray tube;
- power unit;
- vertical/horizontal deflection channel;
- beam modulation channel;
- synchronization and sweep trigger device.
There are controls to control the signal parameters and display it on the screen. Older models did not have a screen. The image was recorded on photographic tape.
Horizontal scan
The horizontal connection channel is connected to the scan generator. It produces signals for the horizontal deflection of beams. The X (sweep) generator operates in several modes.
- Internal synchronization. Self-oscillations with manually set frequency;
- External synchronization. The generator is started from the input pulses. It includes three modes: triggering from an external source, on the edge of pulses or their decline;
- Synchronization from power supply (50Hz);
- Manual start. Also called one-shot.
When studying stable signals, it is convenient to use the internal synchronization mode. Under these conditions, the image will be motionless. To increase stability, you can organize frequency capture at the input by a sweep generator.
This mode is also called standby. In it, the generator starts at the moment when the input signal reaches a certain level. Or from an external source. In external synchronization mode, it is convenient to study not very stable oscillations, especially if there is synchronization between the sweep generator and circuits from the same oscillation source. The device can be adjusted to precisely set the level at which the generator starts.
If synchronization occurs from the power supply, then the start of the sweep will be synchronized with the fluctuation of the supply voltage. So synchronization from the network is also provided to monitor interference and distortion. Manual triggering is suitable for studying a variety of non-periodic signals. For example, in logic circuits.
Vertical scan
The vertical deflection channel is called the Y channel, by analogy with the horizontal Y axis in the coordinate system. In it, the input signal under study is processed. This signal enters the channel through an attenuator. An attenuator is a step level control. This is done to ensure that the amplitude of the parameter being measured does not exceed the permissible level. Meanwhile, the picture did not go beyond the screen. The Y channel can send a signal to the horizontal deflection generator to synchronize it.
Typically, the vertical deflection channel operates in open mode. This means that the beam deflection itself will clearly coincide with the signal level. When there is a constant component, it interferes with the observation of oscillations. This happens due to the fact that the picture will be too shifted to the edges of the screen at the top or bottom. It can also go beyond boundaries altogether. This constant component can be removed if you enable the closed input mode. Or adjust the attenuator to fit the screen size.
About the closed entrance. The signal enters through a capacitor, which does not interfere with the alternating voltage. Then both channels have complete amplifiers that generate the required signal levels, which are fed to the deflection plates.
Below are pictures 1 and 2. This is how the Japanese give oscillograms taken with a dealer’s device. They have all the necessary data to repeat this on any oscilloscope, get a similar signal, compare it and draw a conclusion. There are sweep values, and there is a threshold value at which the oscillogram was taken:
Fig.1
Fig.2
In addition, these two figures also show the verification procedure. Both the upper and lower figures show that the check is carried out in two engine operating modes: at idle and at 2000 rpm. The serviceability of the sensors is assessed by the signal amplitude and time intervals (the scan does not change). Therefore, if I carry out a test with the same Postalovsky oscilloscope or another, I need to set the threshold and sweep and then compare it with the “original”. If the signal is similar, then everything is fine and there is no need to look for anything further. On the right is a clipping from a book from our publishing house - everything is also written and shown (Fig. 3-right).
Below is photo 47 – taken with an oscilloscope. You can compare and analyze.
Photo No. 47
There are no significant differences with the book, if only a little. According to the oscillogram photo No. 47
a malfunction is visible: the car is started, there should be XX speed, but in fact there is none: the speed jumps up and down
(the time intervals of valve operation change. We compare with the book and see the difference - Fig. 3)
About interference
There were, are and will always be obstacles. This
* external interference and their sources are different
* this is interference within the control system itself (mutual influence of electrical circuits, interference during parallel runs of wires, etc.
* interference from power supplies and the operation of other devices included in the control system or internal combustion engine)
The system is protected quite reliably from external interference. From mutual influences and leads too (but here we need to make a reservation: “until the curious have visited these places” -☺.
But let’s look at the third position: “other devices included in…” in a little more detail. Because all troubles come from them. And it is often difficult to detect by some diagnosticians.
The most dangerous interference for the system is power interference. This interference can be quite complex signals. The thing is that in addition to voltage (current) ripples, a wide range of noise can occur in the power circuits, for example, the same spark noise
. If the level of interference is large enough, it will affect control signals and sensor signals, causing the control system to fail.
Photo No. 48
This is what interference in the power circuit looks like when the engine is running
. Such interference does not affect the operation of the system. Although its influence can be seen on all sensor signals and control signals.
Photo No. 49.
This is what the interference created by the starter looks like when starting
.
You can see the area where the starter relay is turned on, the engine cranks and starts running. If you paid attention to the screen, then oscillograms No. 48 and 49 were taken with DC isolation (the zero line is located next to the channel number, and there is no on-board voltage).
This is done in order to isolate the interfering signal.
If you look at the interference signal against the background of the supply voltage, it will be difficult to isolate it, and measuring the level will be extremely inconvenient. Visually it looks like this:
| Photo #50 The measurement is carried out on channel No. 2. I cut out the area of interest so that the grid and values were visible. At a division price of 2V per cell, it is clear that the amplitude of the DC voltage is equal to the on-board network (the oscillogram “rose up from the zero point by 6 grid cells and two points). We see a more accurate amplitude value on the instrument panel (2 channels). Pay attention to the scale and sweep value. If I try to put the same values as in photo 49 - I will get an almost straight line on which nothing can be made out. Of course, you can change the threshold for the input signal, but then we get this (photo 51): |
Photo No. 51.
I changed the threshold, it became 0.2V (it was 2V), changed the scale and scan. But try to take measurements here, either using a grid or using markers.
Therefore, by performing DC isolation, we cut off the on-board power and see only the interference signal.
Why is such a measurement needed? Sometimes it can come in handy.
Photo No. 52
The oscillogram was taken with DC isolation. Start - the engine runs quite steadily.
Marker " B" -
The first consumer who is suspected is turned on.
We get an interference amplitude surge of more than 4V, then you can see how the engine “lost” speed. Marker " A
“—the second suspected consumer immediately turns on, the emission of more than 7V and the engine stalls safely.
The fault has been localized and corrected. For reference to those who are interested:
— An interference level of less than 3% of the amplitude of any signal will not affect the operation of the system. And all those “hedgehogs” that are visible on the oscillogram are RF interference that arises simply from the sparking of the same generator or starter brushes. If anyone wants, they can take a similar oscillogram and, using markers, see what they consist of. There you will find frequencies from several Hz to hundreds of kHz. Only the level of this interference will be very small.
That’s why in the previous material I gave oscillograms of a complex pulse. Because some are looking for the HF component, then they find something in the infrasound range.
Photo#53
This is a complex impulse. And there are many components in it. And its frequency is slightly above the zero mark of the oscilloscope bandwidth.
Photo#54
These are also complex pulses, and a high-frequency modulated signal. It’s also not worth removing it and trying to find something in it and analyze something on a car oscilloscope ( This oscillogram is not mine, it was taken from the author’s material, so I cut off all the inscriptions on it and do not refer to the author. It is not presented for criticism , but as an example, for understanding
.)
Your oscilloscope has a working section in the passband, and that’s where you need to work, it’s quite enough. And the accuracy of measurements on it will correspond. The signal can be viewed and analyzed. If you go beyond this area, the error will be larger; If you go beyond the lane, you will only be able to see: “there is a signal or not.” And the ability to look at “whether there is or not” signals that go beyond the oscilloscope band is made possible by the same frequency response, which does not stop abruptly at the place where the end of the passband is declared, its linearity simply decreases. And it is declining quite slowly. Only these seen signals can no longer have any relation to our measurements.
MARKIN Alexander Vasilievich
Belgorod
Tavrovo microdistrict 2, lane. Parkovy 29B
(4722) 300-709
© 1999 – 2010 Legion-Avtodata
Where is it used?
Areas of application:
- always in scientific, technical laboratories, research departments at factories that produce electrical appliances, for example, the manufacturer must know how his products react to interference;
- during in-depth analysis of assemblies, during adjustment and repair of electrical devices: from radio and cellular communications to machine motor circuits. The device is indispensable for radio amateurs.
The device provides visual information about the characteristics of complex signals, shows time and amplitude data of changes, which is important for calculations and determining how the studied object will behave over periods under specific conditions.
Areas of use
As is already clear from the previous descriptions, oscilloscopes are used to study the shape of periodic and discrete signals. In some measurement cases, it is almost impossible to do without them. A voltmeter and an ammeter only give an idea of the signal levels, a frequency meter - about their frequency, but it is impossible to achieve a complete picture without using an oscilloscope.
One of the significant areas of application is the study of the form of a television signal, where, in addition to the signal carrying information about the transmitted image, there is data on vertical and horizontal synchronization signals, color synchronization pulses and other additional information. Observing oscillographic images of a television signal can greatly facilitate the repair and adjustment of image paths of television receivers.
TV oscilloscope
What can an oscilloscope measure?
An oscilloscope can measure:
- will show by signals: shape;
- frequency;
- period;
- amplitude;
- phase shift angle;
- comparison of signals;
O-Scope is actually a voltmeter, but it displays online voltage changes; it can be used to indicate the shape of the current by connecting a resistor in series to the network being served (Rt, “t” - current, also shunting). Its Ohm number is selected much lower than that of the circuit so that there is no influence on the circuit. Next, it is calculated using the formula and, knowing the value of Rt, you can find the current.
What are they?
After we have found out why an analog and any other oscilloscope is needed, we can move on to its classification. There are 6 main types of measuring instruments:
- Analog. They are considered classic models of measuring devices. An analog oscilloscope is an instrument for measuring average signals. The lower frequency limit is 10 Hz. The price of such equipment is much lower than digital equipment, which is why it is still popular among novice electronics engineers. The main advantage of analog models is the least distortion of the observed signal. Otherwise, they are much inferior to digital technology. Main components of the device: a. input signal divider; b. scheme of synchronization and deviation of the horizontal plane; c. ray tube; d. power unit.
- Digital storage. The devices offer more research and measurement capabilities, so their price is much higher than analog models. Analyzing abilities are the main advantage of storage devices. By setting certain settings, you can force the equipment to record data in digital format immediately after normalization. The signal data image is more stable, and the user can edit the final result by marking or scaling. Examples of digital storage oscilloscopes: TBS1052B Tektronix, TBS1152B-EDU Tektronix, R&S RTC1000. Main components of the device: a. input signal divider; b. normalization amplifier; c. ADC converter; d. information output and input devices; e. Memory device.
- Digital phosphors. Devices of this type operate on a digital phosphor and are considered the most expensive among all types of oscilloscopes. They are able to simulate changes in the intensity of the output data. This feature simplifies the diagnosis of abnormalities in pulse blocks. Examples of phosphor oscilloscopes: Tektronix MSO DPO2000B, Tektronix DPO70804C, Tektronix DPO72304SX.
- Digital stroboscopic. These models use a sequential signal gating effect. They are used to analyze high-frequency repetitive signals whose frequency exceeds the sampling frequency of the device. They sample multiple signal points over several successive periods and then recreate the original waveform. The operating frequency of this type of equipment exceeds 50 Hz. One of the popular models of sampling oscilloscopes is the Tektronix DSA8300. A distinctive feature of the device is a wide selection of optical and electrical modules for testing.
- Portable. Measurement technology is developing rapidly, so compact equipment has become available for conducting signal studies. The advantage of such devices is their low power consumption and small size. Electronics engineers often use portable equipment in their work. Examples of small measuring technology: R&S RTH Scope Rider series, R&S (HAMEG) HMO Compact series.
- Combined. These devices have built-in spectrum analyzers, so they are able to not only collect information about the incoming signal, but also determine the number of harmonics along with the level. Examples of combined equipment: MDO3024 Tektronix, MDO3104 Tektronix, MDO4054C Tektronix.
It will be interesting➡ Description of the electrical circuit diagram with an example
Oscilloscopes are indispensable when measuring the time and amplitude parameters of an electrical signal. Modern device models are also capable of performing spectral analysis.
Kinds
Digital models have recording and archiving functions, which expands the possibilities. To compare results online, devices with several channels are used. There are copies connected to a PC and combinations with other measuring devices.
The choice of analog models (except for simple and educational ones) implies knowledge of a variety of settings, the adjustment is complicated. On the other hand, such devices provide in-depth practice.
Digital models are the recommended choice and will allow you to quickly learn the basics. These are computing systems, with them data acquisition and interpretation are easier and much faster. There are also analog-digital models.
How to choose an oscilloscope: parameters you should pay attention to
To select a device for the specific features of the upcoming operation, it is not enough to know what the oscilloscope measures and how it works. You still need to choose its technical characteristics. The most important indicators include:
- Skipping a lane. Defines the maximum frequency range over which signals can be accurately measured with an attenuation of no more than 70.7%.
- Sampling frequency. Determines the number of samples taken by the device per 1 second of operation. It is optimal to select such an indicator that it is more than 5 times higher than the highest frequency of the signal being studied.
- Setup time. Determines the accuracy of the device when measuring the duration of the front of the studied signals.
- Memory depth. Each device has its own recording resource. And the greater the memory depth, the longer the record it will allow to obtain.
- Rise time. Affects the accuracy of the device when determining the rise time of incoming signals.
- Vertical resolution of the analog-to-digital converter. Indicates the accuracy of the device in the process of converting an analog signal to a digital one. The higher it is, the greater the signal integrity will be.
- Vertical sensitivity. Displays the capabilities of the vertical deflection amplifier. This is especially true when working with weak input signals.
- Number and type of working channels. For analog oscilloscopes, 2, 4 or 8 channels will be sufficient. With their help it will be possible to obtain all the information necessary for the research. But in the case of digital models, where parallel transmission of information is implemented, you cannot do without 8, and sometimes 16 additional channels.
- Starting system. Responsible for capturing signal events. Used when performing more detailed analysis. With its help, repeating waveforms are displayed clearly and correctly. The accuracy of the image and analysis of the incoming signal depends on the flexibility of the trigger system and its initial accuracy.
- Matched probes. There are a number of strict requirements for probes. Thus, its own capacity should be minimal and not create an excessive load on the network of the device under test. But the probe’s bandwidth should be as close as possible to the bandwidth of the oscilloscope itself.
- Simplicity and ease of management. People with different levels of qualifications and training must confidently operate the device. The interface, well-thought-out navigation, etc. are responsible for ease of use.
- Perform automatic measurements. They speed up and simplify signal reception.
- Software. The more flexible the oscilloscope software is, the more efficiency can be gained in the process of diagnosing electrical and optical circuits. Particularly useful when performing compliance testing.
- Navigation and analysis system. Indispensable at the stage of searching for signal anomalies. Automates this process and speeds up getting results.
- Type of food. The oscilloscope can be powered by an electrical outlet or a built-in rechargeable battery. The latter power supply option is mainly implemented in field devices.
- Availability of additional software options. The device must meet both current requirements and potential ones. Some models additionally allow you to expand the bandwidth, add new operating options, and increase the channel memory.
- Interfaces. It is convenient when the device can be connected directly to a PC or transmit information via removable media. This way, working with documentation and data exchange will be simpler and faster.
In order to navigate all these parameters and select an oscilloscope that most accurately matches the task at hand, you need to have in-depth knowledge. And if you have doubts, we recommend that you seek professional help from specialists. They will help you select the appropriate certified equipment for each client’s needs. Consultations can be obtained by telephone or through an online form.
How an oscilloscope works
If you look at quickly passing objects, you will see a blurry line. But if you periodically open the “window”, static frames will be captured. This is the principle of a strobe, the same, but in electronic form the Oscilloscope works.
The action of the “window” is synchronized (the main condition) with the speed of the objects (signal), so when it opens, their place is stable. Otherwise, desynchronization will occur.
The device visualizes periodic changes in real time on the display using a sinusoid or a line of another shape (saw, meander, etc.). Each future segment is similar to the past, it “stops” and is shown (at 1 moment - 1 period).
What does an oscilloscope measure?
The oscilloscope screen displays a two-dimensional picture of the signal that is applied to the measuring input. There are two coordinate axes on the screen. The horizontal is the time axis, the vertical is the voltage. These parameters are measured. And from them the rest is calculated.
The oscilloscope screen displays the signals that are supplied to its inputs. This is, for example, a two-beam analog oscilloscope that shows the waveform at the input (sine wave) and output (square wave) of a pulse voltage converter
Here's what you can measure and monitor with an oscilloscope:
- Voltage (amplitude).
- Time parameters from which the frequency can be calculated.
- Monitor phase shift.
- See the distortions introduced by an element or section of the circuit.
- Determine the constant and temporary components of the signal.
- See if there is noise.
- Calculate the signal-to-noise ratio.
- See/determine pulse parameters.
The signal that the oscilloscope shows is quite informative. The distortions introduced by one or another part are visible; you can track how the shape/amplitude/frequency changes at each point of the circuit, after each part.
In addition to observing the waveform, an oscilloscope can be used to determine the integrity of resistances, capacitors, and inductors (see video below).
Types of Oscilloscopes
How to use an oscilloscope
Based on the principle of internal circuitry, cathode ray oscilloscopes are divided into:
- Analog;
- Digital;
- Analog with digital signal processing.
Historically, analog devices came first because they required conventional analog components to operate the internal components. At the same time, they provided a fairly accurate display of the signal shape, but did not have the ability to measure amplitude and frequency characteristics. The movement of the electron beam, coupled with the distortions introduced by the input path, gave greater nonlinearity in determining the amplitude and frequency of the signal. Thus, only estimation measurements could be made on these parameters.
Observations were only possible for periodic signals.
The advent of special cathode ray tubes made it possible to organize memory for one horizontal scanning beam movement. This was necessary to evaluate single-shot signals or pulsed noise.
Devices with a digital signal processing path, which, after the input circuits of the oscilloscope, are fed to an analog-to-digital converter, have greater capabilities. This algorithm made it possible to accurately measure parameters, including voltage and repetition frequency, pulse duration. Using a storage device, it was easy to organize the storage of any sections of the signal waveform without the use of special tubes.
Digital-to-analog oscilloscopes come in two types. In the first of them, the digital path was used only as an addition to the analog one for measuring parameters, and in the second, it was used to form an image on a CRT. The first type of devices was no different in its parameters from classic analog ones, having an additional option for measuring parameters. The second subtype comes close to fully digital devices, differing only in the information display device.
Digital oscilloscope
Digital oscilloscopes use a liquid crystal display to display information, on which, in addition to the signal shape, all measured parameters are displayed:
- Voltage: amplitude, average;
- Signal frequency;
- Pulse duration;
- Duration of the rise and fall of pulses;
- Phase shifts.
Thus, one device can replace most of the measuring instruments.
The first digital oscilloscopes were characterized by low screen resolution and in this quality were much inferior to analog devices, drawing a highly distorted picture of the signal on the display. Currently, this limitation has been removed, and the image quality is not inferior to a cathode ray tube.
Important! Among the useful qualities of digital oscilloscopes, it should be noted the wide possibilities for storing images and parameters of measured signals at different times, storing information and printing it out or transferring it to external media.
How to connect an imported oscilloscope
You need to carefully read the user manual, prepare a workplace for the device, and properly ground it.
Important! Grounding ensures that when working on the case there will be no dangerous static charge, which could cause a shock if you touched it with your hand.
Next, you need to determine the points to pick up the signal, the zero line, and use a probe to switch them with the attenuator (for unknown signal levels, set the maximum amplitude). Turn on the device, let it warm up, set the necessary modes and take measurements. Take readings and repeat measurements several times.
How to use an oscilloscope
Initially, the operating mode of the oscilloscope is set (self-oscillating, standby or single). Then the attenuator mode is selected or the appropriate voltage divider is installed. This applies to analog devices. Digital at the input analyzes the signal and lowers/increases it to the required level. They have an analytical unit at the input, which itself lowers or increases the input signal to the required level.
The oscilloscope comes with a test cord or cords. Their number depends on the number of input channels of a particular model. If there is one channel, then there is one cord. Maybe two, three and up to sixteen. You need to connect as much as you intend to use.
Oscilloscope cords are difficult to confuse with others. One end has a probe and a branch. This is the "measuring" side. On the other there is a characteristic round connector. This part is connected to the measuring input.
The wire that goes away from the probe is for connecting to ground. It is often equipped with a clothespin or crocodile clip. It is necessary to connect it, the voltage may be different and grounding is necessary.
Oscilloscope Test Cords
Some oscilloscope cords have a switch on the handle that acts as a small amplifier (pictured at right).
After connecting the measuring cords, turn on the device to the network. Then, before work, we move the toggle switch/button to turn on the device to the working position. We can assume that the oscilloscope is ready for use.
Before starting work, you need to check the oscilloscope. We plug it into the network and install the measuring cord. We touch the probe with our finger, a sinusoid with a frequency of 50 Hz appears on the screen - interference from the household electrical network.
If you touch the test probe with your finger, a sinusoidal signal will appear on the screen. The sine wave is not ideal, but if it exists and its frequency is 50 Hz, this means that the oscilloscope is working
Then we take the earth probe and touch it to the measuring probe (we continue to keep our finger on the tip of the probe). The signal disappears (a straight line is displayed). This means that the device is working properly.
As already mentioned, the voltage on the oscilloscope screen is displayed vertically. The entire screen is divided into squares. The vertical division value is set by a switch labeled “V/div”. Which is what Volts means by one division. Before sending a signal, set the beam exactly along the horizontal axis - this is important.
We give a signal and count how many cells the signal rises or falls from the zero level. Then we multiply the number of cells by the “division price” taken from the regulator. As a result, we obtain the signal voltage. In the case of a sinusoid or meander (positive and negative rectangular pulses), the voltage of the half-wave is considered - upper or lower.
Measuring voltage with an oscilloscope
To make it clearer, let's look at an example. In the photo there is a signal, the half-wave of which is understood and lowered by three cells. The division price on the regulator is 5 V. We have: 3 divisions * 5 V/division = 15 V. It turns out that this signal has a voltage of 15 volts.
If you need to measure DC voltage, again set the beam horizontally. Apply voltage and see how many cells the beam “jumped” or fell. Then everything is exactly the same: multiply by the division price and get the constant voltage value.
It will be interesting➡ What is the difference between an RCD and a difavtomat
Frequency is defined as 1/T, where T is the period of the signal. And the period is the time during which the signal goes through a full cycle. For a signal on the screen, this is 5.7 cells. We count from the intersection with the horizontal axis to the second similar point.
How to determine the frequency of a signal using an oscilloscope
Next, we determine the division frequency using the sweep switch. The switch position is set to 50 milliseconds. Take the number of divisions and multiply by the number of cells. We get 50 ms * 5.7 = 285 ms. Convert to seconds. To do this, divide by 1000. We get 0.285 seconds. We count the frequency: 1/0.285 = 3.5 Hz
Electronics for everyone
▌Old article about an analog oscilloscope
Sooner or later, any novice electronics engineer, if he does not give up his experiments, will grow up to circuits where it is necessary to monitor not just currents and voltages, but the operation of the circuit in dynamics.
This is especially often needed in various generators and pulse devices. There is nothing to do here without an oscilloscope !
Scary device, right? A bunch of knobs, some buttons, and even a screen, and it’s not clear what’s there or why. No problem, we'll fix it now. Now I will tell you how to use an oscilloscope.
In fact, everything is simple here - an oscilloscope, roughly speaking, is just... a voltmeter ! Only a cunning one, capable of showing a change in the shape of the measured voltage. As always, I’ll explain with an abstract example. Imagine that you are standing in front of the railway, and an endless train consisting of completely identical cars is rushing past you at breakneck speed. If you just stand and look at them, you will see nothing but blurry garbage. Now we’ll put a wall with a window in front of you. And we begin to open the window only when the next carriage is in the same position as the previous one. Since our cars are all the same, you don’t necessarily need to see the same car. As a result, pictures of different but identical cars will pop up before your eyes in the same position, which means the picture will seem to stop. The main thing is to synchronize the opening of the window with the speed of the train, so that the position of the car does not change when opening. If the speed does not match, the cars will “move” either forward or backward at a speed depending on the degree of desynchronization.
A strobe is built on the same principle - a device that allows you to look at fast moving or rotating crap. There, too, the curtain opens and closes quickly.
So, an oscilloscope is the same strobe, only electronic . And it doesn’t show cars, but periodic voltage changes. For the same sinusoid, for example, each subsequent period is similar to the previous one, so why not “stop” it, showing one period at one time.
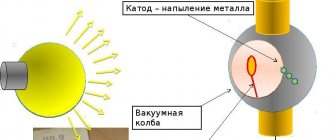
Design This is done by means of a beam tube, a deflection system and a scan generator. In the beam tube, a beam of electrons hitting the screen causes the phosphor to glow, and the plates of the deflection system allow this beam to be driven across the entire surface of the screen. The higher the voltage applied to the electrodes, the more the beam is deflected. By applying a sawtooth voltage to the X , we create a sweep . That is, our beam moves from left to right, and then sharply returns and continues again. And we apply the voltage being studied Y
Principle of operation Then everything is simple, if the beginning of the appearance of the saw period (the beam is in the extreme left position) and the beginning of the signal period coincide, then in one sweep pass one or more periods of the measured signal will be drawn and the picture will seem to stop. By changing the sweep speed, you can ensure that only one period remains on the screen - that is, during one period of the saw, one period of the measured signal will pass.
Oscilloscope time sweep
Synchronization You can synchronize the saw with the signal either manually, adjusting the speed with the handle so that the sine wave stops, or by level . That is, we indicate at what input voltage level we need to start the sweep generator. As soon as the input voltage exceeds the level, the sweep generator will immediately start and give us a pulse. As a result, the scan generator produces a saw only when necessary. In this case, synchronization is completely automatic. When choosing a level, you should take into account such a factor as interference. So if you take the level too low, then small needles of interference can start the generator when it is not needed, and if you take the level too high, then the signal can pass under it and nothing will happen. But here it’s easier to turn the knob yourself and everything will immediately become clear. The synchronization signal can also be supplied from an external source.
Synchronization by level
With theory in the firebox, let's move on to practice. I will show you the example of my oscilloscope, stolen a long time ago from the defense enterprise Design Bureau "Rotor" :). An ordinary oscil, not very sophisticated, but reliable and simple as a sledgehammer.
My trusty oscilloscope
So: I think the brightness, focus and illumination of the scale are self-explanatory. These are the interface settings.
Amplifier U and up and down arrows. This knob allows you to move the signal image up or down. Adding additional offset to it. For what? Yes, sometimes the screen size is not enough to accommodate the entire signal. We have to drive it down, taking the lower limit, rather than the middle, as zero.
Below is a toggle switch switching the input from direct to capacitive. This toggle switch in one form or another is found on all oscilloscopes without exception.
Important thing! Allows you to connect the signal to an amplifier either directly or through a capacitor. If you connect directly, then both the constant component and the variable . only the variable passes through the condenser . For example, we need to look at the noise level of the computer's power supply. The voltage there is 12 volts, and the amount of interference can be no more than 0.3 volts. Against the background of 12 volts, these measly 0.3 volts will be completely unnoticeable. Y gain , but then the graph will go off the screen, and the Y will not be enough to see the top. Then we only need to turn on the capacitor and then those 12 volts of constant voltage will settle on it, and only the alternating signal will pass into the oscilloscope, those same 0.3 volts of interference. Which can be enhanced and seen in full height.
Next comes the coaxial connector for connecting the probe . Each probe contains a signal and ground . The ground is usually placed on the negative or on the common wire of the circuit, and the signal wire is poked according to the circuit. The oscilloscope shows the voltage on the probe relative to the common wire. To understand where the signal is and where the ground is, just grab them with your hand one by one. If you take the general one, then the corpse’s pulse will still be on the screen. And if you take up the signal signal, you will see a bunch of crap on the screen - interference to your body, which is currently serving as an antenna. Some probes, especially modern oscilloscopes, have a 1:10 or 1:100 voltage divider built inside , which allows you to plug the oscilloscope into an outlet without the risk of burning it. It turns on and off with a toggle switch on the probe.
Almost every oscilloscope also has a calibration output . On which you can always find a rectangular signal with a frequency of 1 KHz and a voltage of about half a volt . Depending on the oscillator model. Used to check the operation of the oscilloscope itself, and sometimes it comes in handy for testing purposes
Two hefty knobs: Gain and Duration
Gain serves to scale the signal along the Y . It also shows how many volts per division it will ultimately show. Let's say, if you have 2 volts per division, and the signal on the screen reaches a height of two cells of the dimensional grid, then the amplitude of the signal is 4 volts.
The duration determines the sweep frequency. The shorter the interval, the higher the frequency, the more high-frequency signal you can see. Here the cells are already graduated in milli and microseconds. So, by the width of the signal you can calculate how many cells it is, and by multiplying it by the scale along the X you will get the duration of the signal in seconds. You can also calculate the duration of one period, and knowing the duration it is easy to find the frequency of the signal f=1/t The upper button on the knobs allows you to change the scale smoothly. I usually have it on a click so that I always clearly know what scale I have.
There is also an X input to which you can send your signal, instead of a sweep saw. Thus, an oscilloscope can serve as a TV or monitor if you assemble a circuit that will form an image.
A spinner with the inscription Sweep and arrows left and right allows you to move the graph left and right across the screen. It is sometimes convenient to adjust the desired area to the divisions of the grid.
Synchronization block. Level knob - sets the level from which the saw generator will start. A switch from internal to external allows you to apply clock pulses to the input from an external source. The switch labeled +/- switches the polarity of the level. Not available on all oscilloscopes. Stability knob - allows you to manually try to select the sync speed.
Fast start. So, you turned on the oscil. The first thing you need to do is to short-circuit the signal probe to your own earthenware crocodile. In this case, “Corpse Pulse” should appear on the screen. If it doesn’t appear, then turn the stabilization and offset and level knobs - maybe it just hid behind the screen or didn’t start due to insufficient level.
As soon as the band appears, use the offset knobs to set it to zero. If you have an analog oscill, especially if it’s an ancient one, then let it warm up. After turning it on, mine floats for another fifteen minutes.
Next, set the voltage measurement limit . Take extra if you need to reduce anything. Now, if you attach the ground wire of the oscilloscope to the minus of the battery, and the signal wire to the plus, you will see how the graph jumps by one and a half volts. By the way, old oscilloscopes often begin to falsify, so using a reference voltage source is useful to see how accurately it displays the voltage.
Choosing an oscilloscope. If you just started, then any one will suit you . highly desirable if it is two-channel . That is, it will have two probes and two Gain knobs, for the first and second channel, which allows you to simultaneously obtain two graphs. The second most important criterion for an oscilloscope is frequency. The maximum frequency of the signal that it can pick up. 1 MHz was enough for me so far and I didn’t aim for more. Those oscilloscopes that are sold in stores already have a frequency of 10 MHz and higher. The cheapest oscilloscope I saw cost 5 thousand rubles - OSU-10. A two-channel one already costs 10 thousand, but I set my sights on getting a digital RIGOL DS1042CD for a kilobucks. Different requests - different toys. But, I repeat, 1 MHz is enough for a start, and it will last for a long time. So find yourself at least some kind of oscilloscope. And then you will understand what you need.
How are measurements taken?
We continue to describe how to use a digital oscilloscope or analog
It's important to note that they all have a flaw. One feature worth mentioning is that all measurements are carried out visually, so there is a risk that the error will be high
You should also take into account the fact that sweep voltages have extremely low linearity, which leads to an error in phase or frequency measurements of approximately 5%. To minimize these errors, one simple condition must be met - the graph should occupy approximately 90% of the screen area. When measuring frequency and voltage (there is a time interval), the input signal gain and sweep speed adjustment controls should be set to the extreme right positions. It is worth noting one feature: since even a beginner can use a digital oscilloscope, devices with a cathode ray tube have lost their relevance.
Features of the internal structure
Despite the complex internal equipment based on a CRT, a device with a display can consist of several components. These include:
- Input standard amplifier for observed signals, whose output is connected directly to the vertical deflection plates.
- Cathode ray oscilloscope tube. Widely used in a number of similar measuring instruments.
- Next comes the horizontal scan block. A single type or periodic signal is converted into a sawtooth waveform. It is directed to the plates with the horizontal deflection type of the CRT. In addition, during the falling phase, a pulse is created to suppress the electron beams and is supplied to the CRT modulators.
- Auxiliary or additional parts of the oscilloscope device include a calibrator of duration, possible amplitude and a brightness control unit.
Screen "A" allows you to clearly display the graphs of each incoming input signal. Digital analogues display the desired image on a color or specific monochrome display as a completely finished picture. Other models use a cathode ray tube equipped with electrostatic deflection indicators. Such screens are characterized by markings applied in the form of a coordinate grid, the mission of which is to show the exact location of the data.
An important detail is the signal outputs. Multichannel equipment is designed to measure parameters and simultaneously monitor several signals entering the system. Input Y receives and amplifies the input signal from each of the present channels.
There are two basic types of sweep: waiting and self-oscillating, or automatic. Less commonly you can find models with an additional single-shot mode. Each type has its own specific features:
- One-time launch. The typical trigger mechanism is external influence. So, pressing the button and then waiting for it to start is similar to the standby mode. After launch, deployment is performed once. Resweeping requires another run. Such a system of operation is convenient for studying the functioning of non-periodic processes. The disadvantage is that the luminous spot crosses the display once. The brightness of the picture is insufficient, which seriously complicates the observation process during fast scanning.
- Waiting mode. Insufficient level or absence of signal causes lack of scanning and further fading of the screen. Starting is possible only when the signals reach a certain level specified by the operator. It is possible to configure triggering on either a falling or rising signal edge. It is important to note that when studying non-periodic types of impulse processes, such a system guarantees visual immobility of the picture on the screen. Often, deployment is triggered by a synchronous signal that is somewhat ahead of the observation process.
- Automatic deployment. In this case, the generator operates in a self-oscillating mode. Thanks to this, even in the absence of a signal at the end of the cycle, the next moment of its start will occur. This makes it possible to observe the image on the screen even in a situation where a vertical type of DC voltage deviation or no signal is applied at the input. This mode is characterized by a special locking of the sweep generator frequency by the observed signal. It is important that the frequency of the generators is an integer number of times less than the frequency of the signals under study.
You may be interested in this Characteristics and connection diagram of the SO-505 electric meter
How to use an oscilloscope correctly
After the device and types have become clear, you need to understand how to use the oscilloscope.
It's worth starting with calibration. For this purpose, the outputs of the built-in calibrator are provided, in which the frequency and voltage values are strictly fixed. The image on the screen is adjusted to the norm by adjusting the sensitivity and frequency. It should be remembered that the probes of this device have two outputs, one of which is connected to ground - the common point of the entire electrical circuit.
Next, you need to set the voltage level of the measured signal at the input attenuator. If it is unknown, then the maximum position is set. Typically 100V per screen division. By switching the attenuator you need to ensure that the picture takes up most of the screen.
The next step is to set the desired synchronization mode and frequency of the master oscillator. The duration of the oscillation period is set on the frequency regulator. For example, the switch is set to 20 ms/div. This means that the oscillation period, lasting 20 ms, will fit into one division on the coordinate grid. The frequency will be 50Hz.
By adjusting the level and synchronization, you need to achieve a still image.
To make measurements, you need to follow the algorithm:
- Determine the signal level. That is, count how many vertical divisions the image occupies.
- The number obtained in the first step must be multiplied by the attenuator value.
- Determine the duration of the signal. That is, count how many horizontal divisions the image occupies.
- Multiply the number obtained in the third step by the value of the duration control.
- The frequency must be determined by the formula F=1/T, where F is the frequency, and T is the period of oscillation (the shortest period of time during which the oscillation occurs).
Classification
Capacitor energy
Based on the type of circuitry (electronic components) used, a distinction is made between digital and analog measuring instruments. Simple models show only a dynamic picture. Modern ones are equipped with a memory function to provide better conditions for studying complex processes. Some electronic oscilloscopes are capable of displaying up to 14 or more signals simultaneously. To study optical signals, manufacturers produce stroboscopic high-speed modifications.
Special mention should be made of specialized set-top boxes that connect via a standard port or communication card to a laptop (desktop computer). Such combined equipment can be reconfigured using specialized software.
The vst plugin provides convenient processing of wave processes in the audio range
The difference between an analog oscilloscope and a digital one
The fundamental difference between these varieties lies in size, storage capabilities, and processing methods. For example, analog oscilloscopes transmit signals in real time, without recording capabilities. Analog-digital models allow you to see the dynamics of changes in time or amplitude.
Fully digital analogues, accordingly, are capable of digital processing, digitizing a sine wave and transmitting the resulting information to the display. It should be taken into account that cyclic memory does not allow storing large amounts of data. Therefore, if the user needs to record signals that are five to ten minutes long, an oscilloscope with a large memory depth (storage) will be required.
There are also digital oscilloscopes with a segmented memory mode, which allow you to record only certain information, the form of which is specified by the user through the menu. This makes it possible to study one-time or rarely repeated processes.
Types of oscilloscopes
Based on the principle of signal conversion, oscilloscopes are either analog or digital. There is also a mixed type - analog-digital. The fundamental difference between them is in the methods of signal processing and the ability to memorize. Analog models broadcast a “live” signal in real time. There is no way to record it on such a device.
Analog-to-digital and digital already have recording capabilities. On them you can “unscrew” time back and view information, see the dynamics of changes in amplitude or time.
Another difference between digital oscilloscopes and analog ones is their size. Digital devices have significantly smaller dimensions
Digital oscilloscopes first digitize a sine wave, write this information to a storage device (memory), and then transmit it to the monitor screen. But not all digital models have long-term memory - in this case, recording is carried out cyclically. This is when a newly arrived signal is recorded over the previous one. The memory stores what appeared on the screen, but the period of time is not that long. If you need a recording that is five to ten minutes long, you need a storage oscilloscope.
Using a Digital Oscilloscope
A wide sweep range allows you to monitor even nanosecond intervals, observe signals at various points in the circuit, and measure the rise time of a pulse, which is of great importance when working with digital equipment.
Equipment of various types helps to check, configure and adjust a variety of radio electronics, electronic equipment, repair household appliances and diagnose vehicles. Such devices are widely used in medicine, applied, laboratory and research fields.
Application and interesting facts
Being one of the most important devices in radio electronics and radio engineering, it is widely used for laboratory, applied and research purposes. Allows you to study, control and measure the parameters of electrical signals and radio waves when exposed to a variety of sensors. The device allows:
- Determine the frequency of a signal by measuring its timing characteristics.
- Measure time parameters to obtain the voltage amplitude value.
- Find out the constant and variable of the classical signal.
- Study the phase shifts that occur during the passage of various sections of the circuit.
- Explore the internal mechanisms occurring in an electrical circuit.
- Observe the oscillation frequency and signal distortion features.
- Calculate the ratio of noise and signal, stationarity of noise and possible changes in time parameters.
- Establish operational and periodic monitoring of the quality characteristics of the television path in the television broadcasting system.
The oscilloscope is widely used in vehicle diagnostics and repair. Thanks to its characteristics, it is able to identify faulty catalysts, check the functioning of the actuators, briefly indicate the basic identification information of the system, read the fault code that the system stores, and track changes in the signals of the system sensors.
Scientists have highlighted several interesting facts about the work and creation of a fixing device, popular in the electromechanical field of any production. These include:
- It was the screen of one of the oscilloscopes that was used as the display of the first video game that visualized the game of tennis. The game Tennis For Two was created using analog computers. The control is based on a special game controller - Paddle.
- Radio amateurs use a sound recording path installed on a computer sound card as an input device for measuring low frequencies.
- A common misnomer for the device is “oscelograph”.
- Qualified amateurs of radio electronics, who are not dummies in the world of electronics, began to independently manufacture devices for the oscillography process as an attachment to a PC or TV. Now this need is not so relevant. Mastered technologies for mass production of such goods have low costs.
The basis of any functioning scientific laboratory is high-quality measuring equipment and sources of signals, currents, and voltages. Today, the most important instrumentation for scientific and industrial research is the oscilloscope.
Errors when choosing and working with an oscilloscope
Understanding how to use an oscilloscope comes only with practical experience; theoretical knowledge is not enough - you need to make all the settings, switching and measurements by hand. A digital device greatly facilitates the process, but the cost of the equipment is very high.
Important! You should not buy an old Soviet device, because... Measurement errors will not provide reliable data, and it will no longer be possible to calibrate it.
It is imperative to follow safety precautions: the voltage on a CRT is like on a TV picture tube - it won’t kill, but it can cripple. The passport and manual describe how to work with the oscilloscope, but common sense has not been canceled: you need to experiment carefully.
Additional features and tips
Oscilloscopes can be dual-beam. Dual beam oscilloscopes are needed to image more signals. These devices are equipped with a special CRT with two beams. Its design consists of a glass bulb in which there are two systems of deflecting plates, independent of each other.
One signal is selected as the main signal, the oscilloscope is synchronized with it, and the others are monitored relative to the main signal. To increase the input range, input dividers of 1:10 or 1:100 are used, raising the upper permissible value to 10 or 100 times. This must be taken into account in further calculations to avoid mistakes. The presence of an input divider also increases the input resistance.
Digital oscilloscopes do not require manual calculation of amplitudes and frequencies. These values are displayed on the screen. Moreover, the image can be stored in memory and printed.
When there are no additional Y inputs, to determine phase shifts you need an oscilloscope with an X input, with the internal sweep generator disabled. Then, by applying oscillations to these inputs, phases and frequencies can be compared using “Lissajous figures”.
Next
MiscellaneousPhenomenon of self-induction