Based on materials from the article “Power quality indicators measurement in real distribution network”. Author: Velimir Strugar, certified engineer, master of electrical engineering, Montenegrin Electrical Enterprise, Electricity Distribution Department
The article provides information on the influence of various devices operated in the distribution system of the Montenegrin Electric Enterprise, or more precisely, the distribution network in the city of Tivat. Measurements in Tivat were carried out for more than a year (from April 16, 2004 to the end of July 2005).
Quick navigation through the article:
1. Introduction 2. What is power quality? 2.1. Origin of higher harmonics in the electrical network 2.1.1. Sources of harmonic disturbances 2.1.2. Impact on customer equipment 3. Methods for measuring power quality 4. Results for the control point “high-voltage line “Lepetan” 10 kV” 5. Results for the control point TS 10/04 kV “Selyanovo B” 6. Results for the control point TS 10/04 kV "Selyanovo SIZ" 7. Results for the control point of the TS 10/04 kV "Plavda" 8. Simulation model 9. Equipment for power quality analysis 10. Conclusion
Introduction
In this article we analyzed some control points in the distribution network of the city of Tivat in the Republic of Montenegro. The results of the point data analysis are also presented here. To begin with, we can look at the results for a control point called the high-voltage line “Lepetan” 10 kV. The measurement process covered the secondary currents and voltages of the current and voltage instrument transformers, these values were recorded and analyzed. The measurement results were processed and presented in MS Excel.
In this case, the following measuring equipment was used: a hand-held analyzer “FLUKE 430” and a device for continuous recording of measurement data “Power Quality Analyzer MI 2192”. After taking measurements, when the problem was confirmed, the water supply and sewerage organization had to take action, since it is they who are the main culprit for the fact that the results do not meet the requirements.
The obtained measurement results sometimes exceeded the limit provided by the standards (EN 50160). The excess occurred when the pumps were started. The actual data formed the basis for the development of the simulation model. The resulting model was used to develop a filter to suppress parasitic harmonics in electrical networks. The results of applying the filter are presented. Fortunately, the water supply company installed a passive filter to compensate for the associated harmonics.
What is electricity made of?
The electricity that powers the consumer has several parameters, which we will now consider. These parameters exist for a reason, on their own. A power supply network is a system consisting of several parts that are interconnected and influence each other. Main components of the power supply system:
- Generator (source) of electricity,
- Power line,
- Load.
We are, of course, interested in powering the load. So, let's see what we can measure and see in reality in the power supply network:
Voltage
This is the most important parameter that mainly determines the quality and characteristics of the entire power system. We will consider a three-phase system, despite the fact that in everyday life we are accustomed to one phase.
If the reader is not prepared, I recommend my article - How three phases differ from one.
The old GOST 13109-97 “Standards for the quality of electrical energy in general-purpose power supply systems” stated that the effective (or root mean square, which is the same for sine wave) phase voltage in the supply network should be 220 ± 10% = 198 ... 242 V. However, the new GOST 29322-2014 “Standard Voltages” “increased” the voltage to 230 V ±10% = 207...253 V.
In this case, both 220 and 230 V voltages are allowed ( GOST 29322-2014 , Table 1, Note a). Linear voltages (between phases) will be 380 and 400 V,
And one more addition. According to GOST 13109-97 (clause 5.2), there is a normally permissible deviation (±5%), and there is a maximum permissible (±10%) deviation of voltage from the nominal value. But this GOST has not been in effect since 2014.
GOST 32144-2013 is in force , according to which the rated voltage of the low-voltage network is 220/380 V, and “positive and negative voltage deviations at the point of transmission of electrical energy should not exceed 10% of the rated or agreed voltage value for 100% of the time of an interval of one week” (clause 4.2.2).
GOST R 50571.5.53–2013 is also in force , which speaks of a rating of 220/380 V (Table 53A).
Therefore, since these GOSTs are valid, we can say that the voltage should remain in the range from to 253 V. And the concepts of “normal” and “maximum” deviation are not used now.
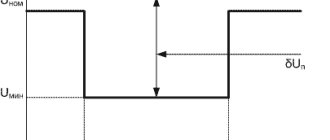
What is really happening in the power grid can be seen on the screen of the Hioki 3197 power quality analyzer:
Linear voltages in a three-phase network
The voltage fluctuates around an average level of 395 V with a deviation of 2..3 V over a measurement period of about 12 minutes. Judging by the identical dips in all phases, a powerful three-phase load is turned on approximately every half a minute for 5-10 seconds. What could it be?
These are linear voltages; phase voltages are not measured in established networks. But if necessary, you can easily convert phase to linear voltage and vice versa using the formula:
Linear voltage formula, dependence on phase voltage
For understanding – Ul = 380 V, Uph = 220 V, and the formula “on the contrary” will look like this:
Formula for the dependence of phase voltage on linear voltage
The schedule given above can be recorded in the device’s memory and last up to several days. In this way, you can analyze how the voltage changes during the day and select a stabilizer, or not install it at all.
In addition (which is very important!), you can record and view all the “artifacts” on the voltage. For example, voltage surges, sags, inrush currents, etc. Event thresholds are set in the settings.
Example of a screen showing events:
Events and details on the quality analyzer screen
Current
Once in my childhood, my father bought me my first tester - TL-4M, for 40 rubles. I measured everything until a “brilliant” idea came to my mind - to measure the current in the socket. I turned on the maximum limit - 3 A, and...
As a result, the plugs were knocked out, the shunt burned out in the tester, and I realized that the current is always measured only THROUGH the load. Since then, the means of measuring current have made great strides forward, and for this purpose only current clamps are used (transformer method), shunts are practically not used.
The current, more precisely, its value, shape and components, depends significantly on the load. For example, here is what the voltage and current waveform looks like when the dimmer is operating:
Mains voltage and current THROUGH the dimmer
Naturally, there are harmonics of current and voltage, which determine the shape.
Voltage and current harmonics
Voltage and current harmonics can be seen in graphical form, both in the screenshot above, and in table form - from the 1st to the 50th harmonics. For both single-phase and three-phase networks.
For example, here is a sign:
List of current and voltage harmonics
I promised that the device is interesting? For the inquisitive mind.
Frequency
Everyone knows that the frequency of the supply voltage in our outlet is 50 Hz . This means that everything is repeated 50 times per second. In other words, the duration of the voltage period is 20 ms.
Have you ever been electrocuted? Remember how your body shook? This is the same 50 Hz. Although, according to my feelings, it shakes with a frequency of 10-20 Hz. Brrr.
More precisely, according to GOST 29322-2014, the voltage frequency should be 50 ±0.2 Hz . That is, from 49.8 to 50.2 Hz.
Perhaps frequency is the only parameter that is not affected by anything. And its stability depends only on the operation of the power plant.
This is what the frequency graph looks like on the screen of a power quality analyzer:
Hioki 3197 – Mains frequency
What is power quality?
There are many definitions of power quality, depending on one's perspective. A simple definition accepted among most customers is that power quality is good if the appliances connected to the power supply operate satisfactorily. Typically, poor or low quality power supplied will result in the computer needing to be rebooted several times, sensitive devices locking up, lights flickering, electronic drives and test equipment not functioning properly. On the other hand, for utility grid companies, power quality is determined by voltage parameters that affect sensitive equipment.
Another definition of power quality is based on the EMC principle and is as follows: The term “power quality” refers to a wide range of electromagnetic phenomena that characterize the voltage and current at a certain point in time at a certain point in the power system (IEEE 1159:1995 IEEE Guidelines for Monitoring Power Quality ").
IEC 61000-4-30 "Test and measurement methods - Methods for measuring power quality" (in preparation) defines power quality as "the characteristics of electricity at a specific point in an electrical system, compared with a set of reference technical parameters." We can describe the level of power quality by the values of harmonic distortion coefficient THDU, THDI and other parameters based on the higher harmonics of voltage and currents.
Origin of higher harmonics in the electrical network
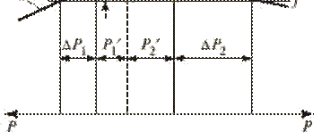
Figure 1 explains the principle of harmonic generation in electrical networks. From the user's perspective, the power supply network can be thought of as a generator G and a design impedance Xs. The generator voltage is considered to be a pure sine wave voltage with a nominal rms value.
The voltage at the consumer connection points differs from the generator voltage due to the voltage drop across the calculated impedance. In the case of a linear load (this example uses a resistor, but this example is suitable for any RLC combination) the current and subsequent voltage drop will also be sinusoidal. The voltage accumulated at the connection points will be purely sinusoidal with a reduced amplitude and phase shift to the generator voltage.
Figure 1. Principle of formation of harmonics in electrical networks
Non-linear loads (rectifiers, variable frequency drives, fluorescent lamps, PCs, TV...) consume current with a high THDI (non-sinusoidal waveform). For analytical purposes, nonlinear loads can be modeled with linear loads and a harmonic (current) source. Current harmonics cause a non-sinusoidal voltage drop across the design impedance and distorted voltage at the power terminals. Non-linear loads distort the supply voltage in such a way that only the odd harmonics can be detected by the meter. If the load is controlled asymmetrically, the positive and negative half-cycles of the current differ in shape and RMS value, resulting in even harmonics and DC current components. This situation leads to saturation and overheating of the magnetic systems of transformers. In some regions, significant DC current components may appear as a result of geomagnetic storms.
Another source of harmonics is the power supply network itself. Magnetization of the transformer magnetic system and its saturation cause non-sinusoidal currents, which appear as harmonic distortion factor THDU at the power terminals. Figure 2 shows how a harmonic disturbance propagates. The voltage waveform at a specific measurement point is distorted by the current generated by all the noise generators (frequency converters, welding machines, PCs, power transformers...) in the system.
Figure 2. Propagation of harmonic disturbance
Harmonic sources:
- single-phase rectifiers - 3rd harmonic, THDI 80%;
- three-phase loads - 5th, 7th, 11th, 13th, 17th harmonics;
- single-ended controlled power supply - even harmonics and direct current;
- the number of pulses is higher - the THDI coefficient is lower;
- series inductance reduces THDI;
- low-voltage power supply network - THDU coefficient 1.5 ÷ 4.5%, mainly the 5th harmonic.
Impact on customer equipment:
- overall energy efficiency decreases;
- premature wear of system components;
- triple harmonics can create high current in the neutral line, leading to overheating and losses;
- increased heating, noise and vibration in transformers and motors;
- the current in the capacitor bank increases with the harmonic order, causing malfunctions;
- the presence of a harmonic increases the likelihood of resonance;
- problems with signal frequencies;
- automatic shutdown of safety devices;
- If the THDU ratio rises above 8%, the failure rate of electronic drives and switches increases.
Electrical energy quality control
5.1 Main tasks and types of power quality control
The main objectives of FE control are:
- Verification of compliance with the requirements of the standard in terms of operational control of PKE in general-purpose electrical networks;
- Checking the compliance of the actual PCE values at the network interface according to the balance sheet with the values recorded in the energy supply contract;
- Development of technical conditions for consumer connection in terms of energy supply;
- Checking the fulfillment of contractual terms in terms of CE with the determination of the permissible calculated and actual contributions of the consumer to the deterioration of CE;
- Development of technical and organizational measures to ensure CE;
- Determination of discounts (surcharges) to tariffs for energy efficiency for its quality;
- Electrical energy certification;
- Search for the “culprit” of PCE distortions.
Depending on the goals solved when monitoring and analyzing CE, PCE measurements can take four forms:
- diagnostic control;
- inspection control;
- operational control;
- commercial accounting.
Diagnostic control of CE -
The main goal of diagnostic control at the interface between the electrical networks of the consumer and the energy supply organization is to detect the “culprit” of the deterioration of the energy efficiency, determine the acceptable contribution to the violation of the requirements of the standard for each electrical energy supply, include them in the energy supply contract, and normalize the energy efficiency.
Diagnostic control should be carried out when issuing and checking the fulfillment of technical conditions for connecting a consumer to the electrical network, when monitoring contractual terms for power supply, as well as in cases where it is necessary to determine the share contribution to the deterioration of the energy efficiency of a group of consumers connected to a common power center. Diagnostic monitoring should be periodic and include short-term (no more than one week) PCE measurements. During diagnostic control, both standardized and non-standardized PCEs are measured, as well as currents and their harmonic and symmetrical components and the corresponding power flows.
If the results of diagnostic monitoring of the energy efficiency confirm the consumer’s “guilty” of violating the energy efficiency standards, then the main task of the energy supply organization together with the consumer is to develop and evaluate the possibilities and timing of measures to normalize the energy efficiency. For the period before the implementation of these measures, operational control and commercial metering of energy efficiency must be applied at the interface between the electrical networks of the consumer and the energy supplying organization.
At the next stages of diagnostic measurements of CE, the control points should be the buses of regional substations to which the cable lines of consumers are connected. These points are also of interest for monitoring the correct operation of on-load tap-changer devices of transformers, for collecting statistics and recording voltage dips and temporary overvoltages in the electrical network. This controls the operation of existing means of providing CE: synchronous compensators, banks of static capacitors and transformers with on-load tap-changers that provide specified ranges of voltage deviations, as well as the operation of protection and automation equipment in the electrical network.
CE inspection control –
carried out by certification bodies to obtain information on the state of certified electricity in the electrical networks of the energy supplying organization, on compliance with the conditions and rules of application of the certificate, in order to confirm that the CE continues to meet the established requirements during the validity period of the certificate.
Operational control of CE -
is necessary in operating conditions at points of the electrical network where voltage distortions exist and cannot be eliminated in the near future. Operational control is necessary at the connection points of traction substations of railway and urban electrified transport, substations of enterprises with electric power supply with nonlinear characteristics. The results of operational control should be sent via communication channels to control centers of the electrical network of the energy supplying organization and the power supply system of an industrial enterprise.
Commercial accounting of PKE –
should be carried out at the interface between the electrical networks of the consumer and the energy supplying organization, and based on its results, discounts (surcharges) to electricity tariffs for its quality are determined.
The legal and methodological basis for ensuring commercial metering of energy in electrical networks is the Civil Code of the Russian Federation (Civil Code of the Russian Federation), part 2, GOST 13109 - 97, Instruction on the procedure for payments for electrical and thermal energy (No. 449 of December 28, 1993 of the Ministry of Justice of the Russian Federation).
Commercial metering of energy efficiency must be continuously carried out at points of metering of consumed electricity as a means of economic influence on the culprit of energy efficiency deterioration. For these purposes, devices should be used that combine the functions of electricity metering and measuring its quality. The presence in one device of the functions of electricity metering and PKE control will make it possible to combine operational control and commercial accounting of KE, while common communication channels and means for processing, displaying and documenting ASKUE information can be used.
Commercial metering devices for energy efficiency must record the relative time of exceeding the normal and maximum permissible values of energy efficiency at the electricity control point for the billing period, which determine the tariff surcharges for those responsible for the deterioration of energy efficiency.
5.2 Standard requirements for power quality control
Monitoring compliance with the requirements of the standard by energy supply organizations and consumers of electrical energy should be carried out by supervisory authorities and accredited CE testing laboratories.
Control of energy supply at points of general connection of electrical energy consumers to general-purpose systems is carried out by energy supply organizations (control points are selected in accordance with regulatory documents). Frequency of PCE measurements:
- for a steady voltage deviation - at least twice a year, depending on seasonal changes in loads in the distribution network of the power center, and in the presence of automatic counter-voltage regulation in the power center, at least once a year;
- for other PKE - at least once every two years, provided that the network diagram and its elements remain unchanged and there is a slight change in the nature of the consumer’s electrical loads, which worsens the KE.
Electricity consumers who deteriorate the EC must carry out monitoring at the points of their own networks closest to the points of general connection of these networks to the general-purpose electrical network, as well as at the terminals of electrical energy receivers that distort the EC.
The frequency of EC monitoring is set by the consumer of electrical energy in agreement with the energy supply organization.
Monitoring of EC released by AC traction substations into electrical networks with a voltage of 6 - 35 kV should be carried out:
- for electrical networks 6 - 35 kV, operated by power systems, at the points of connection of these networks to traction substations;
- for electrical networks 6 - 35 kV, not under the control of power systems, at points selected by agreement between traction substations and electricity consumers, and for newly built and reconstructed (with the replacement of transformers) traction substations - at the points of connection of electrical energy consumers to these networks.
5.3 Discounts and surcharges to the tariff for the quality of electricity
In paragraph 1 of Art. 542 part 2 of the Civil Code of the Russian Federation establishes: “the quality of energy supplied by the energy supply organization must comply with the requirements established by state standards and other mandatory rules, or provided for by the energy supply agreement.”
To ensure the norms of the standard at points of general connection, it is allowed to establish in energy supply contracts with consumers - the “culprits” of the deterioration of energy efficiency, more stringent standards (with smaller ranges of change in the corresponding indicators of energy efficiency) than those established in the standard, which consumers are obliged to maintain at the boundary of the balance sheet ownership of electrical networks.
In case of violation by the energy supplying organization of the requirements for CE, the subscriber has the right to prove the amount of damage and recover it from the energy supplying organization according to the rules of Article 547 of the Civil Code of the Russian Federation. At the same time, given that the subscriber still used energy of inadequate quality, he must pay for it, but at a commensurately reduced price (Clause 2, Article 542 of the Civil Code of the Russian Federation).
Obviously, violations can be mutual and according to different PCEs. The party guilty of reducing the efficiency factor is determined in accordance with the Rules for the application of discounts and surcharges to tariffs for the quality of electricity.
The instructions on the procedure for payments for electrical and thermal energy in section 4 “Discounts (surcharges) to the tariff for the quality of electricity” establishes penalties for the culprit of the deterioration of the energy efficiency.
The mechanism of penalties established by the Instructions does not apply to all PCEs, but to those numerical values whose norms are in the standard:
- steady voltage deviation;
- voltage waveform sinusoidal distortion factor;
- negative sequence voltage asymmetry coefficient;
- zero sequence voltage asymmetry coefficient;
- frequency deviation;
- voltage change range.
Of the listed PCEs, the distortion coefficient of the sinusoidality of the voltage curve and the coefficients of the harmonic components of the voltage reflect the same phenomenon - non-sinusoidality. Moreover, it reflects all the harmonics in total, and each of the 40 harmonics separately. Therefore, the Instructions apply discounts (surcharges) based on the total impact, (coefficient ), in addition, it must be taken into account that discounts (surcharges) for individual PCEs are added up. Therefore, the indicator is not included in the Instructions. The duration of a voltage dip is not included in discounts (surcharges), since the volume of sanctions for the listed PKE depends on the total duration of supply of electrical energy of reduced quality per month, and in terms of voltage dips, the duration of one dip is normalized without standardizing their quantity.
Discounts (surcharges) for the quality of electrical energy are applied in settlements with all consumers.
The value of the discount (surcharge) depends on:
- on the number of PKE for which a violation of the standard occurs at the point of metering of electrical energy during the billing period;
- on the relative time of exceeding the normal and maximum permissible PCE values at the electricity control point during the billing period.
The specific value of the discount (surcharge), depending on the degree of violation of these factors, can be from 0.2 to 10% of the electricity tariff.
Payment at a tariff with a discount (surcharge) for EC is made for the entire volume of electrical energy supplied (consumed) during the billing period. If the energy supply organization is guilty of the violation, the penalty is implemented in the form of a discount from the tariff; if the consumer is guilty, in the form of a surcharge.
For unacceptable deviations in voltage and frequency, the energy supply organization is subject to unilateral responsibility. For voltage deviations, the energy supplying organization is responsible to the consumer if the subscriber does not exceed the technical limits for consumption and generation of reactive power.
Responsibility for violating the standards for the four remaining PKEs rests with the person responsible for the deterioration of the KE. The culprit is determined based on a comparison of the allowable contribution included in the contract to the value of the considered PKE at the control point with the actual contribution determined by measurements.
Methods for measuring power quality
Methods for measuring power quality are based on digital processing of input signals. Each input signal (3 voltages and 3 currents) is sampled 128 times in each input cycle. The duration of this input cycle depends on the frequency of the clock input (one of the three voltage inputs or the current input). At 50 Hz, the input cycle period is 20 ms. Basic measured values are calculated at the end of each sampling period and the results are displayed or recorded. Results based on Fast Fourier Transform (FFT) are calculated only every 8th input cycle (every 160 ms, 50 Hz). The following equations are used to calculate these quantities.
Table 1. Basic calculations
Table 2. Additional calculations (using basic values)
Table 3. Additional calculations (using FFT)
Table 4. General values
In 3ϕ systems with a conventional 3-wire connection, the following values are not available for display or recording:
- current in the neutral conductor;
- voltage-current phase angle;
- phase power factor.
Voltage surge measurements: according to IEC/61000-4-15.
How often should CCE be carried out?
According to GOSTs, the measurement period is once every two years. If deviations from the norm are observed, then such monitoring is carried out twice a year. In the event of a significant change in the load on the network due to a change in season, it is advisable to monitor the quality of electrical energy every three months. Also, appropriate measurements will be required if the magnitude of the loads, their nature, network properties, or changes in their layout change.
A professional energy audit is a fairly significant procedure for the successful operation of a manufacturing enterprise. Our company takes measurements at the time agreed with the customer. This could be once a month, a quarter, or once every six months. It all depends on the client's requirements. Having received the data and analyzed this information, our employees make a report on the quality of electrical energy. The main goal of monitoring the quality of electrical energy is to identify the “culprit” for its deterioration. And, of course, finding ways to solve this problem.
To carry out professional inspection, you need special devices. Currently, manufacturing enterprises in our country do not have such equipment. This fact is a serious obstacle in solving the problems of improving the quality of electrical energy used in these enterprises.
Contact the professionals!
If you need to measure power quality, contact us. We have the necessary equipment and have highly qualified employees with considerable experience of successful work in this area. You will receive comprehensive and accurate information about the quality of electricity at your facility. By contacting us, you are making the right and wise choice!
Results for the control point “high-voltage line “Lepetan” 10 kV”
The 10 kV Lepetan high-voltage line supplies electricity from several 10/04 kV transformer substations to very different loads: agricultural complexes, administrative buildings, apartment buildings, schools, kindergartens, supermarkets, warehouses, water supply and sewerage organizations, barracks, etc. One of the 10/04 kV transformer stations discovered a problem with power quality, since one of the consumers had a very non-linear current waveform. This is a 10/0.4 kV transformer station called “Plavda”. A nonlinear consumer is a water supply station equipped with a pump with powerful asynchronous motors. This particular measurement at the control point of the 10 kV Lepetan high-voltage line was carried out from March to July 2005. Figure 4 shows the location of the transformer substation of the high-voltage line under consideration.
Figure 4. Location of the transformer station of the 10 kV Lepetan high-voltage line
The total length of the Lepetan high-voltage line is about 1.4 km. The following figures show voltage and current waveform diagrams and harmonic spectra.
Figure 5. Voltage waveform of the high-voltage line 10 kV “Lepetan”
Figure 6. Harmonic voltage spectrum of the 10 kV Lepetan high-voltage line
Figure 7. Current curve shape of the high-voltage line 10 kV “Lepetan”
Table 5. Electricity quality indicators of the 10 kV Lepetan high-voltage line
Figure 6 shows the harmonic spectrum of voltages with a predominance of the 5th and 7th voltage harmonics. The greatest influence on the THDU coefficient, if we consider the state of power quality at the beginning of the Lepetan high-voltage line (on the 10 kV electrical bus in the 35/10 kV Tivat TS), was exerted by the 5th voltage harmonic. The main culprit for this level of the 5th harmonic was the water supply and sewerage organization connected to the 10/04 kV Plavda TS. This problem was resolved after the local water supply company in the city of Tivat installed the correct equipment to eliminate high-order harmonics in electrical networks.
Table 6. Numerical values of power quality components
The main performance characteristic of the Lepetan high-voltage line was poor power factor (Table 5). The frequency was within acceptable limits. Table 6 presents the numerical values of power quality for the voltages and currents of the components of the Lepetan high-voltage line.
What parameters can be obtained using an electric meter? Do I need to buy a professional analyzer for quality control? How to prove the guilt of the electricity supplier if losses occur due to poor quality electricity? We will try to answer these questions in this article.
Electricity must be supplied to consumers of appropriate quality. Quality indicators are regulated by GOST 32144-2013. Failure to comply with the requirements of this document may lead to interruptions in the operation of consumer electrical equipment and accidents. Until this happens, most consumers do not think about quality, and if pressed, they are puzzled by the question of how to prove the guilt of the electricity supplier and force it to supply high-quality electricity.
Analyzers specially designed for recording power quality indicators are not widely used due to their high cost. Their price exceeds a hundred thousand rubles. And a cheaper alternative has appeared on the market - to use electric meters, the manufacturer of which has declared the ability to register quality deviations from GOST values. Such meters are produced by many manufacturers; here are a few examples:
| Manufacturer | Brands of meters with registration of quality indicators |
| Incotex | Meters Mercury 234 with index P and meters Mercury 230 and 236 with index Q |
| Concern Energomera | Counters CE-308 with index U |
| Plant named after Frunze | Meters SET-4TM and PSCh-4TM |
The characteristics of all these devices state that they are capable of recording and storing deviations in the quality of electricity in their logs.
Of course, unlike professional quality analyzers, such counters provide control of a small set of indicators, but at the same time they also have a number of undeniable advantages:
- Are affordable
- Provide continuous recording of quality indicators
- Approved as a measuring instrument and sealed by the electrical network company
The latter outweighs everything else. After all, if a controversial situation occurs, you will have to prove that the measurements were carried out at your site with a working and certified device. It is unlikely that your electric network company will register any other device installed on you, if it is not a calculated electric meter. The legal framework does not oblige them to do this. What if you provide them with readings from an unregistered device? Even if it is the most sophisticated analyzer, most likely the electricity supplier will question the fact that the measurements were taken specifically at your facility and in their area of responsibility, that is, along the border of the balance sheet. This becomes especially true if the quality violation was short-lived and the electrical quality problems had been corrected at the time the claim was filed.
And the readings of an electricity meter registered by a specialist from an electrical network organization are very difficult to refute. Therefore, let's look at what capabilities modern meters provide. And as an example, let’s look at the functionality of the Mercury 234 ART-0X P electric meter, which can record in its log:
- Normal permissible values and maximum permissible values of voltage deviation for each phase;
- Normal permissible values and maximum permissible values of frequency deviation of the alternating current network
The indicators collected from the meter can be visualized to see the days when electricity was supplied of poor quality:
Violations recorded by the meter can be compiled into a report and sent to the electricity supplier with demands for compensation for losses or elimination of the causes of poor power quality:
But will the meter readings be considered reliable and the claim justified? To accurately answer the question, let’s turn to another GOST.
GOST 30804.4.30-2013 “Methods for measuring quality indicators of electrical energy” establishes for each measured quality indicator three classes of measurement process characteristics - A, S and B. For each class, measurement methods and corresponding requirements for the characteristics of devices are defined. If accurate measurements are required, for example, when checking compliance with standards establishing power quality standards, when fulfilling the terms of contracts that provide for the possibility of resolving controversial issues through measurements, the device must use measurement class A.
If we take another look at the above table of electricity meter brands, out of all the meters listed, none of the meters measure Class A quality indicators. They all measure Class S, so electricity suppliers can reject claims based on these meter readings, citing for insufficient measurement accuracy.
But the good news is that meters have begun to appear on the market that measure quality indicators according to class A. For example, this is the ESM meter produced by Engineering.
Another possibility for assessing the quality of power supply using conventional electricity meters is to measure the voltage level and frequency in the network. Most digital electricity meters can record instantaneous values with consumption parameters (voltage, current, power, shift angles, cosine phi, frequency). But the processing time for requests for such data is long, so the meters cannot provide the ability to conduct continuous monitoring with receiving data more often than once a minute. Information about consumption parameters is lost between requests, so short-term voltage and frequency exceedances may go unnoticed. However, over a long period of time you will be able to get a more or less reliable picture of the actual voltage and frequency levels.
Instantaneous values received from the meter are not stored in the meter log, unlike events for violation of quality indicators. Therefore, reference to data obtained in this way can only be made if the accounting system used in the survey is certified.
Another important parameter when assessing the quality of energy supply is the frequency of outages and the duration of interruptions in power supply. When there is a power outage, any consumer suffers inconvenience and sometimes losses from downtime. The duration of outages is also regulated by regulatory documents (clause 31 (6) of the Russian Federation Regulations dated December 27, 2004 No. 861). For example, for consumers of the third reliability category, the permissible number of outage hours per year is 72 hours and no more than 24 hours in a row.
The electricity meter log records all power outages. So you can use the information accumulated by the meter and contact your electricity supplier with a demand for compensation for losses from downtime if the total duration of outages exceeds the permissible values.
conclusions
The electric meter is primarily designed to record the amount of electricity consumed, and in terms of recording violations of quality indicators, it has many limitations and is inferior to professional analyzers.
However, meters provide the minimum necessary functionality that gives a general idea of the quality of power supply, as they record the most common cases of violation. A consumer who does not aim to constantly monitor all quality indicators may limit himself to installing electricity meters that record a minimum set of quality indicators. Then, in the event of damage to him, he will be able to use the information accumulated in the meter logs to file a claim with the energy supply company and demand compensation for losses. And for the claim to be satisfied, it is desirable that the metering devices provide measurements of quality indicators in accordance with GOST 30804.4.30-2013 for class A. Copyright - © YaEnergetik, 2022. For any use of published materials and the contents of this article, you must indicate the source “YaEnergetik.rf”
Results for the control point of the TS 10/04 kV “Selyanovo B”
This substation is the first on the Lepetan high-voltage line. The installed power of the power transformer is 630 kVA. This transformer station mainly supplies electricity to private farmsteads, several administrative buildings, a school and a nursery. This station also provides lighting for public places. Information about the recorded voltages is presented in the following figure.
Figure 8. Change in voltage at the control point of the TS 10/04 kV “Selyanovo B”
One part of the changes in the THDU ratio is shown in Figure 9. The maximum THDU ratio was 7.53% and was recorded on June 6, 2005 at 20:07. This value was absolutely unacceptable.
Figure 9. Changes in the THDU coefficient at the control point of the TS 10/04 kV “Selyanovo B”
Figure 10. Changes in the 5th harmonic voltage at the control point of the TS 10/04 kV “Selyanovo B”
We can see the obvious similarity in Figures 9 and 10. At the same moment, the THDU and 5th harmonic voltage coefficients are at their maximum value. It is clear that the 5th voltage harmonic has a dominant influence on the shape of the THDU coefficient curve. The value of the 5th harmonic voltage (4.9%) exceeded the maximum permissible (according to government standards in Hungary and Australia). According to IEEE-519, this value is slightly below the maximum permissible.
How and why to evaluate the quality of voltage in the network?
Really, why? After all, all you have to do is press a button on the TV remote control or plug your iPhone charger into a power outlet and enjoy the benefits of electrification throughout the country!
But there are times when something goes wrong: the crocodile is not caught, the iPhone does not charge, the air conditioner produces a strained hum instead of coolness, and the TV shows no signs of life after a click.
Knowledgeable people have gathered here who understand that the values of the main parameters of the electrical network - voltage and frequency - can be found out primarily using a multimeter. But what to do if you need to see what is happening in the outlet during the day? But what if you need to track a voltage surge that is much shorter in time than the multimeter measurement interval? Moreover, it may be that the time of appearance of this artifact is unknown.
Usually, for any voltage problems, stabilizers are installed, but they do not always help. After all, the stabilizer eliminates the effect, but not the cause of the problem. And if there is an abrupt short-term change in voltage, then the stabilizer will not only not help, but will also worsen the situation.
And in order to understand what to do in this or that case - check the quality of the contacts at the input or install a stabilizer - you need a Power Quality Analyzer.
A power quality analyzer provides a complete picture of what is happening at the outlet.
In my work I use the HIOKI 3197 electrical energy quality analyzer, photos of which will be given in the article.
Without a quality analyzer, it is often completely unclear what is happening in the network: what kind of interference, surge voltages and dips, power factor cos, and so on. You have to act at random, using your experience and experiments. And with the Japanese HIOKI from Nagano everything is clear. In order to get a complete picture of what is happening in the network, the device has clamps for measuring current and clamps for measuring voltage, as well as a clamp for connecting to the neutral. Total - 7 connection points.
Power Quality Analyzer
A real case when you can’t do without a quality analyzer. The controller in the production line periodically froze and generated errors. When everything was shoveled, but the cause was not found, a power quality analyzer came to the rescue. After a short observation of the 220 V voltage supplied to the controller, it turned out that the reason was poor contact inside the surge protector.
Results for the control point of the TS 10/04 kV “Selyanovo SIZ”
This is the second transformer substation on the Lepetan high-voltage line. The installed power of the power transformer is 630 kVA. This transformer substation supplies electricity mainly to buildings, several private houses and lighting of public places. The recorded data is shown in the following figures.
Figure 11. Changes in the THDU coefficient at the control point of the TS 10/04 kV “Selyanovo SIZ”
Figure 12. Changes in the 5th harmonic voltage at the control point of the TS 10/04 kV “Selyanovo SIZ”
Again, we see an obvious similarity between the THDU coefficient and the shape of the 5th harmonic voltage waveform.
Goals of Analysis
Electricity quality measurements make it possible to monitor the supplier’s compliance with the indicators specified in the contract.
Upon completion of the study of electricity parameters, the obtained readings from the analyzers form the basis of a report, which summarizes all information about the operation of the system. If inconsistencies between the indicators and the standards of GOST R 54149-2010 “Standards for the quality of electrical energy in general-purpose power supply systems” are revealed and the requirements for the quality of electricity specified in the contract are not met, then based on the results of the examination, an official claim may be filed with the supplier. In this case, the supplier is obliged to take all effective measures to eliminate the identified violations.
Determining the parameters of electrical energy and the state of the network is necessary when developing a power supply project for an enterprise or other existing structures.
Expertise is often also performed when conducting an energy audit of an enterprise to improve energy efficiency and identify opportunities for increasing energy saving indicators.
Results for the control point of the TS 10/04 kV “Plavda”
This transformer substation supplies electricity to several private farmsteads next to the water supply and sewerage organization in Tivat. The installed power of the power transformer is 1000 kVA. The recorded data is shown in the following figures.
Figure 13. Changes in voltage at the point of the vehicle “Plavda”
Figure 14. Changes in the THDU coefficient at the TS point “Plavda”
Figure 15. Changes in the 3rd harmonic voltage at the control point of the 10/04 kV “Plavda” vehicle
Figure 16. Changes in the 5th harmonic voltage at the control point of the 10/04 kV “Plavda” vehicle
In this case, the 3rd voltage harmonic has a dominant influence on the shape of the THDU coefficient curve (Figure 15). The highest value of the 3rd voltage harmonic occurs early in the morning (4.03%). The water and sewerage company has several small single-phase induction motors and two three-phase variable frequency induction motors.
Simulation model
The simulation model was developed in special software - SuperHarm®. Good agreement between the measurement results and the simulation results was achieved. The simulation was carried out for two operating conditions - low and high load. Also, the use of a passive filter was considered.
Figures 17 and 18 show the current harmonic spectrum before and after connecting the filter for the 7th harmonic. A sufficient reduction in current and voltage distortion has been achieved. The filter was placed at the measurement point at a voltage level of 10 kV. The highest values of the THDU and THDI coefficients are observed during the period of low daily load, so this mode is presented in the upper figures. The situation became better after installing the filter in high load mode. The improvement in voltage quality can be seen in Figures 19 and 20 and is also presented in Table 1. It is noteworthy that the 7th harmonic, THDU and THDI coefficient values decrease after installing the filter (bottom of Table 7).
Figure 17. Current harmonic spectrum before installing a filter at the measurement point
Figure 18. Current harmonic spectrum after installing a filter at the measurement point
Figure 19. Voltage harmonic spectrum before installing a filter at the measurement point
Figure 20. Harmonic voltage spectrum after installing a filter at the measurement point
Table 7. THDI and THDU coefficients at the measurement point before and after filter installation - low load mode
| TS 10/0.4kV Harmonic Current Phase A & C Low Load | ||||||
| Name | Freq | Fund | %THD | H3 | H5 | H7 |
| BUS0.4.A | 50 | 20.0003 | 10.5573 | 0.38219 | 0.77426 | 1.92686 |
| BUS0.4.C | 50 | 20.9483 | 7.26388 | 0.466255 | 1.02319 | 1.02525 |
| TS 10/0.4kV Harmonic Current Phase A & C Low Load Filter Applied | ||||||
| Name | Freq | Fund | %THD | H3 | H5 | H7 |
| BUS0.4.A | 50 | 19.7251 | 6.30617 | 0.398267 | 0.953288 | 0.692753 |
| BUS0.4.C | 50 | 21.2563 | 6.58458 | 0.485869 | 1.25978 | 0.368601 |
| Voltage Harmonic Content Phase A & C Low Power | ||||||
| Name | Freq | Fund | %THD | H3 | H5 | H7 |
| BUS0.4.A | 50 | 19713.6 | 2.9338 | 77.4364 | 195.141 | 538.906 |
| BUS0.4.C | 50 | 20067.3 | 2.85104 | 85.0342 | 276.725 | 493.481 |
| Voltage Harmonic Content Phase A & C Low Power | ||||||
| Name | Freq | Fund | %THD | H3 | H5 | H7 |
| BUS0.4.A | 50 | 19987.4 | 1.22174 | 34.492 | 83.1519 | 226.994 |
| BUS0.4.C | 50 | 20145.8 | 1.26372 | 37.8745 | 122.594 | 219.887 |
What affects the quality of power supply
Long-term distortion of the voltage curve, especially voltage distortion that has a “notch” character, caused by switching power thyristors and diodes in powerful distortion sources, has a negative impact on power electrical equipment and measuring instruments. The most dangerous are distortions of the voltage curve passing through zero. These distortions can cause additional switching of diodes of low-power power supplies, accelerated aging of capacitors, failure of computers and printers and other equipment.
The quality problem in domestic electrical networks is very specific. In all industrialized countries, the connection of powerful nonlinear loads that distort the shape of the current and voltage curves of the electrical network is allowed only if the requirements for ensuring power quality are met and the appropriate corrective devices are available. In this case, the total power of the newly introduced nonlinear load should not exceed 3...5% of the power of the entire load of the energy company. A different picture is observed in our country, where such consumers connect quite chaotically.
The issuance of technical conditions for connection is largely formal due to the lack of clear methods and mass certified instruments that record “who is to blame.” At the same time, the industry practically did not produce the necessary filter-compensating, balancing, multifunctional optimizing devices, etc.
As a result, Russia's electrical networks were oversaturated with distorting equipment.
In some regions, complexes of electrical networks of power systems and consumer distribution networks were formed, unique in their power and degree of distortion of current and voltage curves, which significantly aggravated the problem of supplying consumers with high-quality electricity.
To determine the compliance of the values of measured power quality indicators with the standards of the standard, with the exception of the duration of a voltage dip, pulse voltage, and temporary overvoltage coefficient, a minimum measurement time interval of 24 hours is established, corresponding to the billing period. The total duration of PKE measurements should be selected taking into account the mandatory inclusion of workdays and weekends typical for the PKE measured. The recommended total measurement duration is 7 days. A comparison of the PCE with the norms of the standard must be made for each day of the total duration of measurements separately for each PCE. In addition, PCE measurements should be carried out at the request of the energy supply organization or consumer, as well as before and after connecting a new consumer.
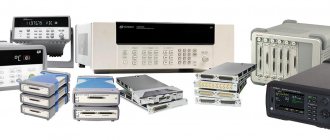
Instruments for measuring power quality
Fluke 430 Series II Analyzers are used to diagnose, assess power quality, predict and troubleshoot power network problems.
Figure 21. Fluke 434-II, 435-II, and 437-II Power Quality Analyzers
Thanks to patented technology, the Fluke 434, 435 and 437 Series II analyzers calculate imbalance and harmonic power to determine true energy losses, and Fluke's unique algorithm shows them in monetary terms. Models vary in functionality, application and tasks and are aimed at specialists of different levels of training :
- The Fluke 434-II is aimed at users with a basic knowledge of power quality assessment. The device determines the basic values of power quality parameters: voltage, current, frequency, power, dips, surges, harmonics, imbalance;
- The Fluke 435-II has similar features to the Fluke 434-II, but is aimed at more experienced power quality users. The model has the PowerWave function, which carries out high-speed data collection based on rms values, shows the half-cycle and waveform that characterize the dynamics of electrical systems and is displayed in high detail on the screen. This allows you to see which combination is causing potential problems;
- The Fluke 437-II is the ideal solution for military, aviation, industrial and other transportation professionals. The 437-II has all the features of the 435-II, including PowerWave, but also has the ability to measure up to 400 Hz.
Read more about the Fluke 430 Series II Power Quality Analyzers on a separate page.
The ideal instrument for analyzing motor performance is the Fluke 438-II portable analyzer. It makes it easy to detect, predict, prevent and correct power quality problems in three-phase and single-phase power distribution systems by providing technicians with the mechanical and electrical information they need to effectively evaluate motor performance.
Figure 22. Fluke 438-II Power Quality and Motor Analyzer. Read more here.
Perform power quality measurements and analysis
The technical equipment of the electrical laboratory of the Stroy-TK Group allows you to carry out work on monitoring and analyzing the quality of electricity received by your enterprise from the network company.
To obtain a sufficient amount of statistical data on all measured parameters, instrumentation is connected at the entrance to the building (room) and continuously takes readings in a weekly (or more) cycle. If there is more than one active input, the measurement cycle is repeated for each of them.
After taking readings and performing their thorough analysis, our ETL specialists prepare a Technical Report on measurements of electrical energy quality indicators, which, in accordance with GOST 33073-2014, contains measurements and protocols for them:
- Voltage deviations;
- Frequency deviations;
- Negative sequence voltage asymmetry coefficient;
- Zero sequence voltage asymmetry coefficient;
- Total coefficients of harmonic components of phase voltages;
- Short-term dose of flicker;
- Long-term dose of flicker;
- Coefficients of harmonic components of phase voltages of the order of n (Phase A (AB));
- Coefficients of harmonic components of phase voltages of the order of n (Phase B (BC));
- Coefficients of harmonic components of phase voltages of the order of n (Phase C (CA));
- The coefficients of interharmonic voltage components are of the order of n1;
- Number of overvoltages by maximum voltage and duration;
- Number of dips in residual voltage and duration;
- Number of voltage interruptions by residual voltage and duration