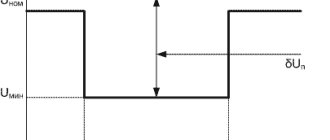
Voltage deviation
The voltage deviation is normalized only at the ED inputs, that is, in fact, only in 0.4 kV networks and at some points in 6–10 kV networks to which high-voltage motors can be connected. They are characterized by the “steady-state voltage deviation” indicator, which is the average voltage deviation over an interval of 60 s. Normal and maximum permissible values of steady-state voltage deviation are equal to ±5% and ±10% of the rated voltage of the electrical network, respectively.
The values of the steady-state voltage deviation in the TOP in networks of 6–10 kV and above should be set taking into account the need to comply with GOST standards at the ED inputs. This means that voltage deviations in other networks are not numerically normalized; they are obtained as a result of calculations.
Frequency and power regulation in power systems
Currently, all generation, virtually all distribution, and most electricity consumption in power grids
are performed on alternating current.
Therefore, the parameters of alternating current - frequency, magnitude and shape of the voltage curve - have acquired the meaning of unified parameters, in accordance with which all sources, means of transmission and receivers
of electrical energy are designed. This especially applies to frequency. In practice, only two standard frequency values have been preserved - 50 Hz in European countries, including Russia, and 60 Hz in the USA and Canada.
During operation of the power system, all alternating current parameters can change. The closer they are maintained to nominal, i.e. calculated values for the equipment, the closer the mode is to the optimal one. Thus, frequency acquires the value of an indicator characterizing the quality of products of the energy industry, the quality of electricity.
Frequency is not only an indicator of power quality
, but also the most important
parameter of the power system mode
. The continuity of electricity production, the lack of ability to store energy and the continuous change in consumption require equally continuous monitoring of the compliance of production and consumption. The parameter characterizing this correspondence is frequency.
The frequency in the power system is determined by the overall balance of generated and consumed active power. If the balance is maintained, then the frequency remains unchanged. If the power balance is disturbed, i.e. When a power imbalance appears, a transient process of frequency change occurs. By the speed and direction of frequency change, one can judge the magnitude and sign of the active power imbalance
. If the frequency in the power system decreases, then to restore the normal frequency it is necessary to increase the active power generated at power plants.
The frequency control task is divided into three interrelated parts:
· primary frequency regulation
, ensuring frequency stability, i.e. maintaining frequency deviations within acceptable limits in the event of a violation of the overall power balance in any part of the power system;
· secondary regulation
, ensuring restoration of the normal frequency level and planned modes of power exchange between parts of the power system or regions;
· tertiary regulation
, by which we can understand the prompt adjustment of regional power balances in order to provide mutual assistance to the regions and prevent dangerous overloads of transit
power lines
.
Let's take a closer look at primary frequency regulation
.
It is carried out by automatic turbine speed controllers
(ARSC). Each turbine is equipped with a regulator, which, when the rotation speed of the turbine unit changes, changing the position of the turbine's control elements (control valves for a thermal turbine or a guide vane for a hydraulic turbine), changes the inlet of the energy carrier (steam or water).
When the rotation speed increases, the regulator closes the turbine control elements and reduces the energy inlet, and when the frequency decreases, it opens the control elements and increases the energy inlet. The static characteristics of two parallel operating units equipped with an AFC are shown in Fig. 3.3.
From Fig. 3.3 it is clear that as the frequency decreases from f ‘
to f
“
in accordance with the static characteristics of the regulated units, the active power they generate increases by ∆
P
1 and ∆
P
2, respectively, which helps maintain the frequency level in the power system.
The power increment ∆ P
is proportional to the rated power of the unit and depends on the slope of the characteristic.
And the slope is characterized by the magnitude of staticism
.
With a flatter characteristic 2, there is less static and a greater change in power
∆
P. A unit with a steeper characteristic 1
has more static.
Thus, the total increase in power is distributed between the units in proportion to the rated power and inversely proportional to the regulation statistic. If it is necessary for a unit to take a greater part in the primary frequency regulation, it is necessary for this unit to have greater power and less droop
.
The dead zone has a significant impact on the regulation process
automatic speed controller, which is necessary to tune out small random load fluctuations in the power system.
If there is a dead zone of the regulator, a range of uncertainty appears in the load distribution between the units. In Fig. 3.4 two parallel lines, spaced vertically from each other by the value of the dead zone ∆finch, limit the range of possible states of the regulator and the unit. The condition is characterized by frequency f and load P
(the so-called operating point).
In steady state
at a given frequency, for example f1, the operating points of all units are located on the line f = f1, but can occupy random positions between the above boundary lines (between points
a
and
b
in Fig. 3.4).
Range of uncertain load values during parallel operation of units with regulators having a dead zone
, is directly proportional to the dead zone of the regulator ∆finch and inversely proportional
to the statism
of the control characteristic. To improve the quality of frequency regulation, it is necessary to achieve less droop if possible. However, with less static, the uncertainty of the unit load increases significantly. Therefore, on regulators with greater insensitivity, it is necessary to set a higher droop coefficient. The amount of static on hydraulic turbines can usually be changed quickly. The dead zone of domestic hydraulic turbine regulators does not exceed 0.03 Hz. According to technical specifications, the dead zone of domestic steam turbines is up to 0.15 Hz. The amount of staticism cannot be changed quickly and is usually 0.04-0.05 (4-5%). The accuracy of load distribution provided by steam turbine regulators is low: 6-7%. But it is impossible to further increase the droop, since this threatens to increase the maximum deviation of the rotation speed when the load is shed, which is dangerous for the integrity of the turbine.
The static characteristics of individual turbine regulators determine the static characteristics of the power system as a whole. In Fig. 3.5 shows the characteristics of the equivalent generator P
g(f) and the dependence of the power of the total load of the power system
P
n on frequency.
Power consumed by various types of electrical receivers
, depends differently on frequency. For example, the power consumed by incandescent lamps and other thermal installations is practically independent of frequency. But the power consumed by machine tool motors, pumps and fans is highly dependent on frequency. In general, the frequency dependence of the power of the complex load of the power system, consisting of electrical receivers of all types, has approximately the same form as in Fig. 3.5.
The fact that the power consumed by the load decreases as the frequency decreases facilitates the task of primary regulation ( P"
—
Р'
< ∆
Р
in Fig.
3.5). With an increase in load power and a transition from the P'n
to the
P"
n curve, the frequency decreases, and under the influence of
automatic turbine speed controllers,
the generated power increases from
P'
to
P"
.
Within a few seconds
there is a transition from point
1
to point
2
(Fig. 3.5). In this case, the power balance is restored, but at a reduced frequency.
The steeper the generation characteristic P
g(f), the more effective
the primary regulation
and the smaller the frequency deviation ∆f, i.e.
more stable frequency in the power system. From Fig. 3.5 it can be seen that the power system has a reserve of generated power, so it is possible to increase this power as the load power increases. But if not all units have a generating capacity reserve, then the slope of the equivalent generation characteristic P
g(f) decreases and the frequency deviation ∆f increases, i.e. the effectiveness of primary regulation decreases.
It should be noted that with any degree of effectiveness, primary regulation
although it limits frequency deviations,
it is not able to restore the normal frequency level
after the appearance
of a power imbalance
.
The task of restoring the normal frequency level is solved by secondary regulation
.
In contrast to primary regulation, secondary regulation takes place within a few minutes
. As a result of the action of secondary regulation and restoration of the normal frequency, mode changes caused by primary frequency regulation are eliminated. Power plants and consumers return to their original operating mode. Compensation for the entire initially occurring power imbalance is taken over by secondary frequency control power plants until the regime is normalized at the site of its initial disturbance.
Secondary frequency control power plants
must be sufficiently powerful and maintain the required range of regulation, and have good maneuverability.
The power units of thermal power plants are designed for basic operating mode. However, at present they are increasingly involved in regulating the daily load schedule, and their range of regulation is limited. The maximum permissible unloading of blocks depends on the type of fuel burned and is 20-40% when operating on coal and 40-60% when operating on gas and fuel oil. Unloading power units inevitably leads to a decrease in their efficiency. Already at loads of 50% of the nominal load, their efficiency deteriorates by 5-6% when operating on gas-oil fuel and by 7-8% when operating on coal. Hydraulic units have a significantly larger control range (except during flood periods) and a smaller dead zone
of the AFC.
Therefore, it is usually hydroelectric power plants
that are involved in secondary frequency regulation.
Secondary regulation is carried out by moving the unit's AFC characteristic parallel to itself using the turbine control mechanism. The characteristic of the equivalent generator also moves accordingly, as shown in Fig. 3.6.
In large energy systems, there is a need to maintain correspondence between the production and consumption of electricity not only in the energy system as a whole, but also in its individual parts (regions). This need may be associated with the economic independence of parts of the power system or with insufficient capacity of power transmission lines, which limits the exchange of power between parts of the power system. Maintaining a match between consumption and production within regions requires regulating not only frequency, but also power flows.
With the growth of power systems and their interconnection, frequency fluctuations decrease, but the need to regulate flows usually increases, as the likelihood of weak connections with insufficient capacity increases. Therefore, regulation of power flows becomes in many cases a task no less important than frequency regulation. Since it is very difficult to solve this problem manually, automatic frequency and power control
.
In interconnected power systems, two basic principles of secondary frequency and power control
:
· centralized frequency regulation in combination with regional power plant power regulation;
· decentralized integrated regulation of frequency and power flows.
Based on the centralized principle
lies in the regulation of frequency by one power system, i.e.
power balance throughout the entire energy system, regardless of where the power imbalance occurs, and regulation of their power flows by other power systems, regardless of frequency. This principle is sufficiently effective if the regulating power system has sufficient power reserve and control range and if the intersystem power lines do not limit their capacity to compensate for power imbalances
that occur in any power system.
The main disadvantage of this principle is the unequal relationship between the energy systems of the association, one of which bears the cost of maintaining control capacities for all energy systems.
The principle of decentralized secondary regulation
the most common in the world practice of regulating the regime in interstate associations of power systems of various countries (UCTE, NORDEL, etc.).
The main advantage of this principle is the fair and equitable participation of parallel operation partners in maintaining normal frequency levels and agreed power flows. This ensures the elimination of power imbalance in a given power system, regardless of whether it is the only cause of frequency deviation or exists simultaneously with the presence of imbalances in other power systems.
The disadvantages of the principle include the need for surgical intervention to restore the frequency if the “culprit” power system does not eliminate its imbalance. In this case, tertiary regulation of the mode
.
In conclusion, we will briefly consider the current state of frequency and power regulation in the Unified Energy System of Russia. The possibility of creating an East-West energy interconnection based on the use of existing 400-750 kV AC power lines between Ukraine and Central European countries is analyzed and explored. In this regard, studies have been carried out on the quality of frequency regulation in the Western and Eastern zones of the future energy interconnection. Studies have shown lower frequency stability in the Eastern zone (average daily frequency deviations in the West are 10-20 MHz, and in the East - larger values). Particularly large deviations in the East occur in the spring and in the second half of the night, which indicates a lack of flexibility in the means of regulation, especially in power units of thermal power plants, difficulties in unloading power units and the inadequacy of means of short-term regulation, which is mainly explained by the following reasons:
· the size and characteristics of the rotating reserve are not strictly regulated;
· large thermal and especially nuclear power plants practically do not participate in frequency regulation due to their low maneuverability and the unpreparedness of equipment and process automation for this;
· due to the unsatisfactory structure of generating capacities (insufficient power of hydroelectric power plants, one pumped storage power plant for the whole of Russia, lack of power units with good maneuverability at thermal power plants, etc.), it is not possible to maintain a power balance at normal frequency during certain night hours and during flood periods due to insufficient regulation range of thermal power plants. The 300 and 800 MW power units are underutilized in primary and secondary frequency control. One of the reasons for this is the lack of material interest of power plants in actively participating in frequency regulation in the power system.
Currently, measures are being developed that will improve the quality of frequency regulation in the UES of Russia, which is important not only in connection with the prospect of creating an East-West energy interconnection, but also for the UES of Russia itself.
Voltage fluctuations
Voltage fluctuations are characterized by two indicators:
- voltage change range;
- flicker dose.
The permissible range of voltage changes depends on the frequency of occurrence of the ranges and is normalized by the curve in Fig. 8.18. The curve was obtained based on an assessment of the negative impact of flashing incandescent lamps on human vision and is not related to other electronic devices, although it normalizes voltage fluctuations in the network as a whole. The application of this curve does not encounter difficulties with the same amplitudes of the swings, repeated after certain periods of time. Usually, the ranges of voltage changes in the TOC are chaotic; their amplitudes and frequencies of occurrence are formed by many EPs and direct application of the curve in Fig. 8.18 becomes impossible. A procedure is used to weigh fluctuations and obtain an integral indicator, which is called the “flicker dose”. This procedure is quite complex, can be implemented only with the help of special devices (flicker meters) and is of interest mainly for developers of these devices and therefore is not considered here. In the presence of voltage fluctuations, the sum of the steady-state voltage deviation δUy and the range of voltage changes δUt at points of connection to electrical networks with a voltage of 0.4 kV should not exceed 10% of the rated voltage.
Causes of frequency deviation in electrical systems
As is known from the TOE course, in normal steady state, the total power generated by all generators in the electrical system must be exactly equal to the total power of all electrical receivers connected to the system at the moment. In this case, the rotation speed of the system generators (and they all rotate synchronously), and therefore the frequency
in the electrical system, must remain constant and equal to the nominal
−
50 Hz (in the USA, Japan and a number of other countries 60 Hz).
Any imbalance between generated and consumed power causes a change in the rotation speed of the generators, i.e., the frequency in the system.
In case of emergency shutdown
one (several) generators or
connecting
powerful loads in the system, there is a shortage of active power.
The electrical load (their current output) on the generators remaining in operation increases. At the same time, the turbines of these generators begin to slow down, which leads to a decrease
in the frequency in the system.
Automatic frequency regulators (AFCs) increase the supply of steam to turbines (or water to hydraulic turbines) and their speed (power) increases; accordingly, the voltage frequency generated by working generators increases to the nominal value.
Such frequency maintenance is possible only if there is an active power reserve in the generators, that is, if the generators were partially underloaded until the moment in question. If all power reserves are exhausted, the system cannot restore frequency.
When disconnected
powerful loads, excess generated power appears in the system, since the power generated by the generator turbines at the first moment remains unchanged, which leads to
an increase
in their speed and, accordingly, the frequency in the system. At the same time, the speed regulators of the steam turbines come into effect, which slightly reduce the steam supply (in hydraulic turbines, the water supply), thereby reducing the power generated by the generator until a new power balance is achieved in the system.
The speed controllers of steam turbines operate quite quickly, so load shedding leads to a slight increase in frequency and its rapid restoration to the nominal value. In hydraulic turbines, regulators act more slowly and their rotation speed (frequency) can increase to 120 - 140%.
19) The influence of frequency deviation on the operation of electrical receivers, the requirements of regulatory documents for frequency deviations.
The influence of frequency deviation on the operation of electrical receivers and electrical systems
A slight decrease in frequency (a few tenths of a hertz) does not pose a serious problem for the electrical system, but such a decrease in frequency does not have a favorable effect on the operation of consumers. As the frequency decreases, the rotation speed of electric motors (especially asynchronous ones) and, accordingly, the performance of the mechanisms they drive decrease.
At some enterprises, a deviation from the nominal frequency can lead to disruption of production technology; a decrease in frequency by 3–5% disrupts the operation of radio equipment and a number of automatic control devices. As the frequency decreases, the reactive power of transformers and rotating machines increases sharply, which reduces the efficiency of electrical networks.
A decrease in frequency has an extremely negative effect on the operation of thermal power plants. So, for example, a decrease in frequency by 3–5 Hz entails a 20–40% reduction in the supply of water to the condenser by circulation pumps. This leads to a decrease in the available power (the power that can be generated) of the station, which in turn leads to a further drop in the frequency in the system. This dangerous phenomenon is called “frequency avalanche”.
Requirements of regulatory documents for AFR devices
According to the PUE [11], the automatic frequency reduction device must prevent the operation of the electrical system at frequencies below 45 Hz, the operating time with a frequency below 47 Hz should not exceed 20 s, and with a frequency below 48.5 Hz - 60 s.
GOST for power quality [8] normalizes the following frequency deviations:
— normally permissible deviations (in normal operating modes)
±0.2 Hz;
— maximum permissible deviations (in post-emergency modes)
±0.4 Hz.
Operating principle of AFR, categories and queues of AFR
Operating principle of the AChR
An emergency reduction in frequency caused by a sudden significant deficit of active power is fleeting in nature - a few seconds. Therefore, only automation can counter this decline. Initially, the automation uses all active power reserves in the system. Serviceable generators of the system take on the maximum load (taking into account permissible short-term overloads).
If after these automatic actions the frequency continues to decrease (which indicates an active power deficit that has not been eliminated), the only way to equalize the amounts of generated and consumed power is to turn off some of the least critical power receivers.
Such shutdowns are carried out by special electrical automation devices - frequency shedding machines - AFRs.
AFR devices, as a rule, are installed at substations of the electrical system; they can be installed directly at consumers, but under the control of the electrical system [8].
PUE [8] divides AChR devices into two categories: AChRI I and AChRI II.
First category – АЧРI
designed to prevent a deep decrease in frequency at
the initial moment of the accident development
.
These devices are fast-acting (with time delays tAFR
≤ 0.5 s) and frequency response settings from 47 - 48 Hz to 46 - 46.5 Hz. To implement ACPI, consumers are disconnected in small groups, according to priority. The first-stage power receivers are switched off, for example, when the frequency drops below 48 Hz. If the frequency decrease continues, the power receivers of the second stage are switched off with a setting of 47.5 Hz, then the third - with a setting of 47 Hz. The minimum difference in the frequency settings of the nearest queues is assumed to be 0.1 Hz. AChRI is equipped with approximately 75 - 80% of the total electrical load equipped with AChRI.
Second category – AChRIII
designed to restore the frequency if it
remains low for a long time
, figuratively speaking, “freezes” at a level of about 48 Hz. The frequency settings for ACHRII are taken to be the same and 0.5 Hz higher than the upper setting for ACHRI. Unlike AChRI, significant time delays are introduced into the operation of AChRI II in the range of 15 – 90 s, differing from each other by 5 s. Such relatively long shutter speeds are necessary to connect power reserves, in particular, to start hydrogenerators. Approximately 20–25% of the total electrical load equipped with AChRII devices are equipped with AChRII devices.
21) Electrical diagram of the AFR device on electromechanical
relay, circuit operation.
In Fig.
Figure 7.1 shows a diagram of an AFR device using a constant operating current using electromechanical or electronic relays. KF frequency relay
(electromechanical type IVCh-3 with induction operating principle or electronic type URCH-3M).
KF
relay controls the frequency of the primary network through the measuring voltage transformer
TV
.
When the frequency drops below the set point, the KF
closes its contact in the
KT
.
The direct operating voltage generated by the UGV
(for example, type BPZ-401) is supplied to the winding of the
KT
(type EV-100 or VL-68).
The latter, after a given time delay, will close its contact KT
in the circuit of windings of the indicating relay
KH
(type RU-21) and the intermediate relay
KL (
type RP-23). A detailed description of these relays is given in laboratory work 1 and 2.
The intermediate relay closes its contacts KL1 and KL2,
by sending trip commands to the breaker actuators
Q1
and
Q2.
The switches operate, turning off the electrical receivers connected through them.
Closed contacts KL3
form a command to prohibit automatic reclosure.
KH
indicator relay signals the maintenance personnel about the fact of operation of the AFR device.
Non-sinusoidal voltage
Non-sinusoidal voltage is characterized by two indicators:
- voltage waveform sinusoidal distortion factor;
- coefficient of the nth harmonic component of voltage.
These indicators are defined as values averaged over an interval of 3 s.
Rice. 8.18. Permissible voltage fluctuation ranges
The sinusoidal distortion coefficient is determined by the formula, %:
The harmonic values are normalized to n = 40. The permissible KU values are given in table. 8.4.
Table 8.4
Acceptable values of sinusoidal distortion coefficient
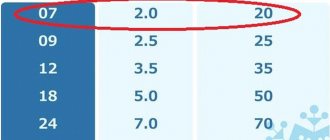
Normally permissible values of the coefficient of the nth harmonic component of voltage are given in table. 8.5.
Table 8.5
Normally permissible values of the coefficients of harmonic components
Normally permissible values given in table. 8.5 for n equal to 3 and 9 refer to single-phase electrical networks. In three-phase three-wire electrical networks, these values are taken to be half those given in the table.
The maximum permissible values of the coefficients of the harmonic components of voltage are 1.5 times higher than the normally permissible values.
Voltage asymmetry
Voltage asymmetry is characterized by two indicators:
- negative sequence voltage asymmetry coefficient;
- zero sequence voltage asymmetry coefficient.
These indicators are defined as values averaged over an interval of 3 s.
The normally permissible and maximum permissible values of both voltage asymmetry coefficients are 2.0 and 4.0%, respectively. The zero sequence asymmetry coefficient makes sense only for four-wire electrical networks of 0.4 kV; the standards for the negative sequence asymmetry coefficient are the same for networks of any voltage.