One of the leading indicators characterizing the operation of an enterprise is the production capacity utilization rate. Persons involved in organizing the labor process need to know what this parameter describes and how its value is determined.
The ratio provides information useful for optimizing the production process
Determination of the coefficient
This ratio shows how much production equipment is used in practice, compared to the figure achieved at the maximum possible load on the line. It is one of the indicators of a company’s productivity and makes it possible to evaluate the effectiveness of the technologies and work methods used, and to identify problems with the rational operation of machines. This will contribute to better alignment of the production process and optimization of equipment use.
Important! The coefficient can be used not only to evaluate the performance of a factory, workshop or other industrial enterprise, but also for a company engaged in trade or providing services to the public. This is how they determine how productive the team and the technical means used are.
Information collection method
At first, data for calculating real and potential power values is collected manually and entered into specially prepared reports. Once the second value has been established, subsequent calculations can be automated based on available data and trends.
ANALYSIS OF WEAR OF EQUIPMENT FLEET
When analyzing the condition of equipment, special attention is paid to its physical and moral wear and tear (equipment may completely fail due to wear and tear).
Physical wear and tear is a loss of consumer value or material wear and tear (change in consumer properties or technical and economic indicators). Physical wear is characterized by the gradual wear and tear of individual equipment elements under the influence of various factors: service life, load level, quality of repairs, corrosion, oxidation, etc.
Assessing the degree of physical wear and tear is necessary, since the consequences of wear and tear are manifested in a variety of aspects of the enterprise’s activities (in a decrease in the quality of products, a drop in equipment power and a decrease in its technical productivity, an increase in the costs of maintaining and operating equipment).
Obsolescence is functional wear. Equipment wears out due to the emergence of new means of labor, in comparison with which the social and economic efficiency of old equipment is reduced.
The essence of obsolescence is the reduction in the initial cost of equipment as a result of the emergence of more modern, productive and economical types.
The main factors determining the amount of obsolescence:
- frequency of creation of new types of equipment;
- duration of development period;
- the degree of improvement of the technical and economic characteristics of new equipment.
IT IS IMPORTANT
It is ineffective to operate obsolete equipment, so it needs to be replaced before the onset of physical wear and tear.
The ideal situation is when the period of physical wear and tear coincides with moral wear, but in real life this is extremely rare. Typically, obsolescence occurs much earlier than the life of the equipment.
To ensure a continuous production process, the following main forms of wear compensation : repair, replacement and modernization. For each type of equipment, the technical services of the enterprise determine the optimal ratio of forms of wear compensation that meets the requirements of the organizational and technical development of the enterprise in modern conditions.
Depreciation
Equipment, being a durable item, wears out and transfers its value to products gradually through depreciation. In other words, this is the accumulation of funds for the restoration of equipment, which is carried out in parts due to wear and tear.
According to the Tax Code of the Russian Federation, depreciable property is property with a useful life of more than 12 months and an original cost of more than 100,000 rubles.
Depreciation charges are a monetary expression of the degree of depreciation of fixed assets (FPE), which is included in production costs and forms a source of funds for the purchase of equipment to replace worn-out equipment or a method of returning capital advanced into equipment.
Depreciation groups and their corresponding useful lives are established in accordance with Decree of the Government of the Russian Federation dated January 1, 2002 No. 1 (as amended on July 7, 2016) “On the Classification of fixed assets included in depreciation groups.” In this case, the residual value of fixed assets is determined as the difference between the original cost and the amount of depreciation of fixed assets.
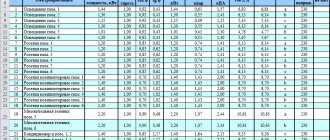
Let's calculate the amount of depreciation charges by year (linear method) (Table 4).
| Table 4. Accounting for depreciation of equipment in | ||||||
| Name of fixed asset | Depreciation group | Useful life | Initial cost, rub. | Annual amount of depreciation, rub. | Years of operation of fixed assets | |
| first | second | |||||
| Equipment No. 1 | 1 | 2 years | 57 140,17 | 28 570,09 | 28 570,09 | 28 570,09 |
| Equipment No. 2 | 1 | 2 years | 46 524,71 | 23 262,36 | 23 262,36 | 23 262,36 |
| Total | 103 664,88 | 51 832,44 | ||||
When the entire cost of the fixed asset is transferred to the cost of manufactured products through depreciation deductions, then the amount of deductions will correspond to the original cost of the fixed asset, depreciation will no longer be accrued.
Calculation formula
What is power factor
The basic formula used to calculate the coefficient is as follows:
K = Vfact/Msr,
Where:
- Vfact is the volume of products manufactured over a certain time,
- Мср – average production capacity for the same time period.
Formula for finding power utilization factor
The production capacity formula used in the calculations is calculated using additions and disposals on the enterprise's balance sheet over the past period (usually annual). The power of a certain type of equipment can be calculated in two ways: using the labor intensity of a unit of production or the productivity of one piece of equipment.
Production Capacity Formulas
Target values
As a guide, you can use 80%, which is the average for United States firms. In Europe it is slightly higher – 82%.
FRB and ISM usage indices
In the US Manufacturing Capacity Survey, the FRB Capacity Utilization Index asks firms "the maximum level of production that this facility could reasonably expect under normal and actual operating conditions using fully available plant and equipment."
In contrast, the Institute for Supply Management (ISM) index asks respondents to measure their current output relative to "normal capacity," and it produces a utilization rate that is 4 to 10 percentage points higher than the FRB measure. Again, the time series shows more or less the same historical movement.
See Federal Reserve Board: Industrial Production and Capacity Utilization.[1]
Measurement Features
Introduction to Demand and Usage Ratio
The data used for future calculations is collected manually every working day. If possible, automatic data recording is organized - this will help to spend less time and labor resources to find the real workload indicator. The potential indicator is calculated for a certain time period and then substituted into the formula.
Important! The final coefficient can be determined both for a single machine or line, and for a workshop or enterprise as a whole. So for different scales, data is recorded at different frequencies: statistics for an individual machine are collected several times a day (for example, once an hour), and for the entire company it is calculated over a longer period: monthly, seasonal or annual.
Standard and interpretation of meaning
Transformation ratio
The indicator under consideration does not have a clear fixed regulatory framework. For different categories of firms, the boundaries of the target range will be different, especially when applied to human resources. However, the resulting figure may indicate the following:
- If the result is below 0.7, technological processes are not organized rationally, and there is a need to change work strategies (optionally also in additional production capacity).
- At a higher value, operational efficiency can be increased internally by the enterprise.
- If the coefficient is equal to one (100% utilization), the resources owned by the company are used to the maximum. If there is a goal to produce even more products, the purchase of additional units of equipment will be required. The coefficient cannot exceed 100%.
Important! The final figure may be influenced by a number of third-party factors: a sudden change in the situation at the company or in its environment, competing companies, changes in demand.
Calculation example
You can get an idea of the methodology, for example, based on the performance indicators of a plant producing pellets. For each of the types of equipment used (mills for various purposes, a drying drum, an apparatus for forming granules, etc.), the planned and actual volume of processed raw materials in cubic meters is recorded and the coefficient is calculated on their basis. You can divide the month into three decades and generate statistics for each of them and for the month as a whole.
For example, the most productive of the machines used was the drum. Then the coefficient value will be the highest. If you want to increase the productivity of other types of machines, they need to be loaded more intensively. The higher the coefficient of a particular machine, the greater the load relative to its potential it bears. 80-85% is a good indicator, but even in this case, it is acceptable to strive for an increase due to the presence of 15-20% of spare capacity.
Practical application of CMM
Calculating an indicator for a single machine or machine makes it possible to find out the following data:
- are there any episodes of downtime in the work process, and what causes them;
- How in demand is this piece of equipment, and how often is it used;
- what part of the profit is the machine responsible for;
- Is it possible to operate a piece of equipment more efficiently, is it worth upgrading.
Determining the coefficient for the organization as a whole will be able to show:
- how much it is possible to increase the volume of products produced or services provided;
- whether the installed equipment is operated efficiently;
- how busy the production lines are;
- within what limits the cost of products can increase (with a low coefficient, an increase in production volume is possible, associated with an increase in the cost of a single copy).
To determine the potential for increasing production volume, you need to find out the value of the gap (let's denote it P) between the possible and actual quantity of products produced. It is calculated by the formula:
P = (ROP-POP)/POP * 100%,
where ROP is the actual volume of production, and POP is the potential.
ECONOMIC EFFICIENCY OF USING FIXED ASSETS
To analyze the economic efficiency of using fixed assets, a number of indicators are used. Some indicators assess the technical condition, others measure the output of finished products relative to fixed assets.
Indicators characterizing the technical condition of equipment
The depreciation coefficient ( Kizn ) reflects the actual depreciation of fixed assets:
Kizn = Am / First × 100%,
where Am is the amount of accrued depreciation, rub.;
First - the initial cost of fixed assets, rub.
An important point: it is generally accepted that the critical permissible value of the wear coefficient is 50% . Exceeding this level is undesirable.
acquired fixed assets in January 2016 (see Table 4) with a useful life of two years. Depreciation amounts to:
RUB 51,832.44 / RUB 103,664.88 × 100% = 50%.
This indicator characterizes a high degree of wear. This is due to the fact that the company's fixed assets belong to the first depreciation group with a short useful life.
The serviceability coefficient of fixed assets ( Kgodn ) is the inverse indicator of the wear rate. It shows what proportion the residual value of fixed assets is from their original cost:
Kgodn = 100% – Kizn.
Let's calculate the serviceability coefficient of fixed assets: 100% - 50% = 50% .
The level of serviceable fixed assets is 50%, which indicates severe wear and tear of fixed assets due to a short service life.
Age composition of equipment
To develop measures to improve the use of equipment, it is necessary to control the age composition of different types of equipment, determining suitability. The age composition is characterized by grouping equipment according to the period of its operation (Table 5). Analysis of the age composition by equipment groups is carried out in the context of workshops and production areas.
| Table 5. Analysis of the age composition of equipment, % | |||
| Age groups of equipment | Indicator value | Change | |
| last year | reporting year | ||
| Up to 5 years | 5,10 | 5,70 | 0,60 |
| From 5 to 10 years | 21,90 | 21,50 | –0,40 |
| From 10 to 20 years | 67,30 | 67,70 | 0,40 |
| Over 20 years | 5,70 | 5,10 | –0,60 |
| Total | 100 | 100 | |
A positive trend is an increase in the share of young equipment (age groups 1 and 2) with a service life of up to 10 years. In this case (see Table 5) we can conclude that the enterprise put new equipment into operation, as a result of which the share of young equipment in the reporting year amounted to 27.20% (5.70% + 21.50%) compared from 27% (5.10% + 21.90%) last year.
Notes
1. With long service life, significantly exceeding the standard, the technical and economic characteristics of the equipment deteriorate (accuracy of parts processing, equipment productivity, growth rate of production volumes), product quality deteriorates, and production defects increase. At the same time, the costs of equipment repair and operation are growing significantly.
2. As physical wear and tear increases, unscheduled downtime associated with equipment malfunction increases, the duration of the repair cycle changes, and the costs of maintenance and repairs increase.
Economic indicators characterizing the efficiency of use of fixed assets
Capital productivity ( Fotd ) is a general indicator characterizing the output of finished products per 1 ruble. fixed assets. If the coefficient decreases, this can be explained by the fact that the increase in labor productivity is less than the increase in fixed assets (the reason for this situation is the depreciation of fixed assets and the high costs of their repair and maintenance). In general, the coefficient shows how effectively all groups of equipment are used:
Fotd = Qreal / Sr/g,
where Qreal is the volume of product sales in the reporting period, rub.;
Avg/y — average annual cost of fixed assets, rub. (arithmetic mean between the value of fixed assets at the beginning and end of the reporting period).
Let's calculate capital productivity for Alpha LLC under the following conditions:
- planned sales volume - 3190 units. chairs priced at RUB 24,000. for a unit;
- the average annual cost of fixed assets is RUB 25,916.22.
Fotd = 3190 units. × 24,000 rub. / RUB 25,916.22 = 2954.13 rub.
This is a very high figure, indicating that for 1 rub. fixed assets account for 2954.13 rubles. finished products. There are two explanations for this situation: 1) the production of chairs is not automated; workers do most of the work manually; 2) the cost of some equipment is below 100,000 rubles, and according to tax legislation is not depreciated.
Notes
1. A positive trend is considered to be an increase in the volume of product sales with a decrease in the cost of fixed assets. In this case, a conclusion is drawn about the effective use of fixed assets.
2. The capital productivity ratio can be influenced by optimizing equipment loading, increasing labor productivity and the number of work shifts.
Capital intensity ( Femk ) is an indicator inverse to capital productivity, characterizing the cost of fixed assets per 1 ruble. finished products. The coefficient allows you to determine the impact of changes in the use of fixed assets on the overall need for them. A reduction in the need for fixed assets can be considered as conditionally achieved savings in additional long-term financial investments. Formula for calculating capital intensity:
Femc = Cavg/g / Qreal.
Let's calculate the value of the indicator for the analyzed enterprise:
Femk = 25,916.22 rubles. / (3190 units × 24,000.00 rub.) = 0.00034.
The coefficient shows that for 1 rub. finished products account for 0.00034 rubles. cost of fixed assets. This indicates the efficient use of fixed assets.
An important detail: a decrease in capital intensity means an increase in the efficiency of organizing the production process.
Capital-labor ratio ( Fvrzh ) characterizes the degree of equipment of the labor of the main production workers and shows how many rubles the cost of equipment falls on one worker:
Fvrzh = Ssr/g / Count,
where Count is the average number of employees, people.
Let us calculate the capital-labor ratio for , if the average number of employees is 52 people.
Fvrzh = 25,916.22 rubles. / 52 people = 498.39 rub .
RUB 498.39 per main production worker. value of fixed assets.
Notes
1. The capital-labor ratio directly depends on the labor productivity of workers in the main production and is measured by the number of products manufactured by one employee.
2. A positive trend is considered to be an increase in the capital-labor ratio along with an increase in the labor productivity of main production workers.
Return on fixed assets ( return on assets , ROS ) - characterizes the profitability of fixed assets of the enterprise. This indicator contains information about how much profit (revenue) is received per 1 ruble. fixed assets. The indicator is calculated as the ratio of net profit (sales proceeds, profit before tax) to the average annual cost of fixed assets (the arithmetic mean between the cost of fixed assets at the beginning and end of the reporting period):
ROS = PE / Sr/g,
where PE is net profit, rub.
Let's calculate the value of the capital profitability indicator for the analyzed enterprise, provided that its net profit in the reporting period is RUB 4,970,000.00.
ROC = 4,970,000.00 rub. / RUB 25,916.22 = 191,77.
Notes
1. The return on fixed assets indicator does not have a standard value, but its growth in dynamics is positive.
2. The higher the value of the coefficient, the higher the efficiency of using the enterprise's fixed assets.
Renewal coefficient ( Kob ) - characterizes the rate and degree of renewal of fixed assets, calculated as the ratio of the book value of received fixed assets to the book value of fixed assets at the end of the reporting period (the initial data for the calculation is taken from the financial statements):
Kob = Dream. OS/Sk,
where is Snov. OS - cost of acquired fixed assets for the reporting period, rub.;
Ск — cost of fixed assets at the end of the reporting period, rub.
The fixed asset renewal ratio shows what portion of the fixed assets available at the end of the reporting period consists of new fixed assets. A positive effect is considered to be a tendency for the coefficient to increase in dynamics (evidence of a high rate of renewal of fixed assets).
An important detail: when analyzing the renewal of fixed assets, you need to simultaneously evaluate their disposal (for example, due to sale, write-off, transfer to other enterprises, etc.).
Retirement coefficient ( Kvyb ) is an indicator characterizing the degree and rate of disposal of fixed assets from the production sector. It represents the ratio of the value of retired fixed assets ( Svyb ) to the cost of fixed assets at the beginning of the reporting period ( Сн ) (the initial data for the calculation is taken from the financial statements):
Kvyb = Svyb / Sn.
This ratio shows what part of the fixed assets that the enterprise had at the beginning of the reporting period was disposed of due to sale, wear and tear, transfer, etc. The analysis of the retirement ratio proceeds simultaneously with the analysis of the renewal ratio of fixed assets. If the value of the renewal coefficient is higher than the value of the retirement coefficient, then there is a tendency to update the equipment fleet.
Production capacity utilization factor is an indicator determined by the ratio of the annual volume of planned or actual production to its average annual capacity.
The company's planned production output is 3700 pcs., the average annual production capacity (maximum quantity of products) is 4200 pcs. Hence the degree of utilization of production capacity:
3700 pcs. / 4200 pcs. = 0.88 , or 88%.
Notes
1. The production capacity utilization factor can also be used at the preliminary stages of forming a production program.
2. The value of the utilization factor cannot exceed one or 100%, since production capacity represents the maximum possible volume of output under the best production conditions.
3. The ideal utilization rate is 95%, with the remaining 5% intended to ensure flexibility and continuity of the production process.
Shift coefficient ( Ksm ) is an indicator reflecting the ratio of actually worked time to the maximum possible operating time of equipment for the analyzed period (can be calculated for the entire workshop or group of equipment). Calculation formula:
Kcm = Fcm / Qtotal,
where Fsm is the number of machine shifts actually worked;
Qtot — total amount of equipment.
The enterprise has 61 pieces of equipment installed. During the first shift, only 48 units of equipment worked, and during the second shift, 44 units. Let's calculate the shift ratio: (48 units + 44 units) / 61 units. = 1,5.
Notes
1. The shift coefficient characterizes the intensity of use of fixed assets and shows how many shifts each unit of equipment works on average annually (or per day).
2. The value of the shift coefficient is always less than the value of the number of shifts.
Equipment load factor ( Kz. ob ) is an indicator that is calculated on the basis of the production program and technical standards for the production time of products. It characterizes the use of the effective operating time of equipment for a certain period and shows what equipment load the production program provides. It can be calculated for each unit, machine or group of equipment. Calculation formula:
Kz. ob = Trpl / (Fpl × Kvnv),
where Trpl is the planned labor intensity of the production program, standard hours;
Fpl is the planned operating time of the equipment, h;
Kvnv is the coefficient of fulfillment of production standards, which is determined using the average percentage of fulfillment of production standards.
An important detail: compliance with production standards is accepted on the condition that 25% of the advanced core production workers fulfill these standards above the average percentage.
Let's say there are 50 workers in the assembly shop. fulfill production standards as follows: 25 people fulfilled the production norm by 100%, 15 people by 110%, 10 people by 130%.
At the first stage, we determine the average percentage of fulfillment of production standards:
(25 people × 100%) + (15 people × 110%) + (10 people × 130%) / 50 people = 109 %.
Thus, 25 people who fulfilled the production standard by more than 109% can be considered advanced workers. The share of frontline workers who fulfilled the production norm by 130% is 40% (10 people / 25 people × 100%). Consequently, the coefficient of fulfillment of the production norm should be taken in the amount 130 %.
To calculate the equipment load factor, it is necessary to determine the labor intensity of the production program, taking into account the current standards for types of equipment. For Alpha LLC, the labor intensity of the production program is 99,000 standard hours (the number of equipment is 61 units).
The effective working time fund (EF per unit of equipment was calculated earlier) will be 103,273 hours (1693 hours × 61 units of equipment).
Let's find the equipment load factor for the analyzed enterprise:
Kz. rev = 99,000 standard hours / (103,273 h × 1.3) = 99,000 / 134,254.90 = 0,74.
As calculations show, the level of equipment utilization makes it possible to fulfill the production program for the planned period .
Notes
1. The equipment load factor obtained by calculation has a high value, approaching unity. Its value should not exceed one, otherwise measures will have to be taken to increase equipment productivity and increase the shift ratio. At the same time, a certain reserve must be provided in the degree of equipment load in case of unforeseen downtime, changes in technological operations and restructuring of the production process.
2. If fluctuations occur in the market (growth/decrease in demand) or force majeure circumstances, the enterprise must promptly respond to any changes. To achieve better quality of products and improve their competitiveness, you need to monitor the use of production capacity, and for this you need to constantly improve and update the operation of equipment and increase labor productivity (these two factors underlie the work of any manufacturing enterprise).
Power factor
The coefficient, denoted as cos φ, shows the proportion of the highest possible power provided by an alternating electric current due to voltage delay. It is equal to the cosine of the angle of displacement of these two quantities. The range of possible values of the indicator is between zero and one. For fully capacitive (capacitor elements) or inductive (transformers and other devices with coils) circuits, the angle in question will be right, and accordingly, its cosine is 0. Moreover, for elements of the first type, the current leads the voltage, for the second - vice versa. In absolutely resistive circuits, the electric current flows in phase with the applied voltage, the angle is 0, and its cosine is 1. With a fixed power indicator and a constant voltage, the current strength will decrease with increasing cos φ.
Problems with low cos φ
The importance of this indicator is due to its responsibility for maintaining inductive load. When the ratio is too low, the problem may be rooted in a distorted current waveform or a large phase difference between it and the voltage at the load terminals. A coefficient value of one is ideal; a value below 0.8 is definitely insufficient. At low values, a corresponding percentage of power (for 0.8 this is 20%) is retained in the system, which can damage the generator or engine (in particular the bearing elements). This also places an additional load on the wires; they require greater thickness. Having to handle more current results in lower overall efficiency due to increased heat loss.
Solving the problem of low cos φ
Most often, installation of a switched group of capacitor elements parallel to the electrical circuit is used for this purpose. You can set the unit to turn on and off automatically based on the values of various system indicators. More often, capacitors are placed in the primary electrical network of a power substation.
Low coefficient correction is carried out through the use of capacitors
Capacity Requirements Planning (CRP)
The use of these systems aims to increase the efficiency of equipment, teams of employees, and conveyor lines. The point is to plan and find a workload balance to implement the plan to release the final product. It is necessary to plan the required volumes of capacity for each type of product manufactured, taking into account the structure of the technological process. The system generates a report on discrepancies between the required load and the available capacity.
Planning for production capacity requirements
Capacity factor is an important parameter that helps determine how much efficiency a plant, individual production line, or piece of equipment has to improve efficiency. Carrying out calculations using it will help optimize production and identify which equipment and technological processes need modernization or replacement.
Data
The average U.S. manufacturing capacity utilization rate since 1967 has been about 81.6%, according to the Federal Reserve. The figure for Europe is not much different, and for Japan it is only slightly higher.
The average industrial capacity utilization rate in some major regions of the world in 2003/2004 is estimated as follows (rounded figures):
Average utilization rate
- USA 79.5% (April 2008 - Federal Reserve measure)
- Japan 83–86% (Bank of Japan)
- European Union 82% (Bank of Spain estimate)
- Australia 80% (National Bank estimate)
- Brazil 60–80% (various sources)
- India 70% (Hindu business)
- China, probably 60% (according to various sources)
- Türkiye 79.8% (September 2008 - Turkish Statistical Institute)[2]
- Canada 87% (Statistics Canada)