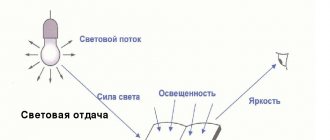
General information
Luminous intensity is the power of the luminous flux within a certain solid angle. That is, the intensity of light does not determine all the light in space, but only the light emitted in a certain direction. Depending on the light source, the luminous intensity decreases or increases as the solid angle changes, although sometimes this value is the same for any angle if the source distributes the light evenly. Luminous intensity is a physical property of light. In this way, it differs from brightness, since in many cases, when they talk about brightness, they mean a subjective sensation, and not a physical quantity. Also, brightness does not depend on the solid angle, but is perceived in the general space. The same source with a constant luminous intensity can be perceived by people as light of different brightness, since this perception depends on environmental conditions and on the individual perception of each person. Also, the brightness of two sources with the same luminous intensity may be perceived differently, especially if one produces diffuse light and the other directed light. In this case, the directional source will appear brighter, even though the luminous intensity of both sources is the same.
Luminous intensity is considered as a unit of power, although it differs from the usual concept of power in that it depends not only on the energy emitted by the light source, but also on the wavelength of the light. The sensitivity of people to light depends on the wavelength and is expressed by the function of relative spectral luminous efficiency. The luminous intensity depends on the luminous efficiency, which reaches a maximum for light with a wavelength of 550 nanometers. This is green. The eye is less sensitive to light of longer or shorter wavelengths.
The luminous intensity of one candle is approximately equal to one candela
In the SI system, luminous intensity is measured in candelas
(kd).
One candela is approximately equal to the intensity of light emitted by one candle. the candle
(or international candle), is sometimes also used One candle is approximately equal to one candela.
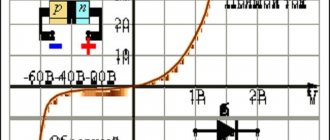
Luminous intensity diagram
If you measure the luminous intensity using a plane that shows the spread of light, as in the illustration, you can see that the magnitude of the luminous intensity depends on the direction towards the light source. For example, if the direction of maximum emission of an LED lamp is taken to be 0°, then the measured luminous intensity in the 180° direction will be much lower than for 0°. For diffuse sources, the luminous intensity for 0° and 180° will not be much different, and may be the same.
In the illustration, light emitted by two sources, red and yellow, covers an equal area. Yellow light is diffused, like candle light. Its strength is approximately 100 cd, regardless of direction. Red is the opposite, directional. In the direction of 0°, where the radiation is maximum, its strength is 225 cd, but this value quickly decreases with deviations from 0°. For example, the luminous intensity is 125 cd when directed at a source of 30° and only 50 cd when directed at 80°.
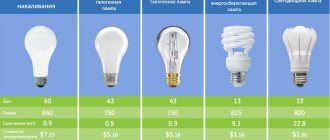
Lumen values for different lighting fixtures
Modern requirements for the packaging of lighting devices require that their technical characteristics be communicated to the consumer in full. Therefore, finding the value in lumens under the abbreviation “lm” or “lm” will be easy. For example:
- incandescent lamp 100 W – 1300-1500 lm;
- incandescent lamp 60 W “General Electric” – 660 lm;
- energy-saving lamp “NetHaus”, halogen 13 W – 250 lm;
- LED lamp “Gauss Elementary” 12 W “as at 100 W” – 1130 lm;
- LED lamp “Gauss Elementary” 6 W “like 60 W” - 420 lm;
- LED lamp Elektrostandard LTB0201D 60 cm 18V – 1200 lm;
- LED table lamp Maytoni Nastro, 15 W – 900 lm;
- office lamp TL-ECO with LEDs 48.5 W – 4530 lm (total luminous flux after all losses).
As can be seen from the ratio of luminous flux to device power, LED lighting devices are the most economical and efficient in luminous output.
Attention! Since from January 1, 2022, all compact, tubular and industrial fluorescent lamps containing mercury and other hazardous metals are prohibited in the Russian Federation, they are not included in the list.
The power of light in museums
Museum staff measure the light intensity in museum spaces to determine the optimal conditions for visitors to view the works on display, while at the same time providing gentle light that causes as little damage as possible to museum exhibits. Museum exhibits containing cellulose and dyes, especially those made from natural materials, deteriorate from prolonged exposure to light. Cellulose provides strength to fabric, paper and wood products; Often in museums there are many exhibits made from these materials, so the light in the exhibition halls poses a great danger. The stronger the light intensity, the more museum exhibits deteriorate. In addition to destruction, light also discolors or yellows cellulose-containing materials such as paper and fabrics. Sometimes the paper or canvas on which the paintings are painted deteriorates and breaks down faster than the paint. This is especially problematic since the paint on a painting is easier to restore than the base.
Paris, Versailles
The damage caused to museum exhibits depends on the wavelength of light. For example, light in the orange spectrum is the least harmful, and blue light is the most dangerous. That is, light with longer wavelengths is safer than light with shorter wavelengths. Many museums use this information and control not only the total amount of light, but also limit blue light using light orange filters. At the same time, they try to choose filters that are so light that, although they filter out blue light, they allow visitors to fully enjoy the works exhibited in the exhibition hall.
It is important not to forget that exhibits deteriorate not only from light. Therefore, it is difficult to predict, based only on the intensity of light, how quickly the materials from which they are made will degrade. Long-term storage in museum spaces requires not only low lighting, but also low humidity and low oxygen levels, at least within display cases.
Sign prohibiting flash photography
In museums where flash photography is prohibited, they often refer specifically to the harm of light to museum exhibits, especially ultraviolet light. This is practically unfounded. Just as limiting the entire spectrum of visible light is much less effective than limiting blue light, banning flash has little effect on the extent of light damage to exhibits. During the experiments, the researchers noticed slight damage to the watercolors caused by professional studio flash only after more than a million flashes. A flash every four seconds at a distance of 120 centimeters from the exhibit is almost equivalent to the light that is usually found in exhibition halls, where the amount of light is controlled and blue light is filtered. Those who take photographs in museums rarely use such powerful flashes, since most visitors are not professional photographers and take photos with phones and compact cameras. Flashes in the halls rarely work every four seconds. The damage from the ultraviolet rays emitted by the flash is also in most cases small.
Luminous intensity of lamps
The properties of lamps are usually described using luminous intensity, which differs from the luminous flux - a value that determines the total amount of light and shows how bright this source is in general. It is convenient to use luminous intensity to determine the luminous properties of lamps, for example, LED lamps. When purchasing them, information about the light intensity helps determine with what strength and in what direction the light will spread, and whether such a lamp is suitable for the buyer.
Light intensity distribution diagram
Light intensity distribution
In addition to the luminous intensity itself, luminous intensity distribution curves help to understand how the lamp will behave. Such diagrams of the angular distribution of light intensity are closed curves on a plane or in space, depending on the symmetry of the lamp. They cover the entire range of light propagation of this lamp. The diagram shows the magnitude of the light intensity depending on the direction of its measurement. The graph is usually plotted in either a polar or rectangular coordinate system, depending on the light source for which the graph is being plotted. It is often placed on lamp packaging to help the buyer imagine how the lamp will perform. This information is important for designers and lighting engineers, especially those who work in the field of cinema, theater, and the organization of exhibitions and performances. Luminous intensity distribution also affects driving safety, which is why engineers designing vehicle lighting use luminous intensity distribution curves. They must comply with strict regulations governing the distribution of light intensity in headlights to ensure maximum safety on the roads.
The example in the figure is in the polar coordinate system. A is the center of the light source, from where the light spreads in different directions, B is the luminous intensity in candelas, and C is the angle of measurement of the direction of the light, with 0° being the direction of the maximum luminous intensity of the source.
Measuring the intensity and distribution of light intensity
Light intensity and its distribution are measured with special devices, goniophotometers
and
goniometers
. There are several types of these devices, for example with a movable mirror, which allows you to measure light intensity from different angles. Sometimes, instead of a mirror, the light source itself moves. Typically these devices are large, with a distance of up to 25 meters between the lamp and the sensor that measures light intensity. Some devices consist of a sphere with a measuring device, a mirror and a lamp inside. Not all goniophotometers are large; there are also small ones that move around the light source during measurement. When purchasing a goniophotometer, the decisive factors, among other factors, are its price, size, power, and the maximum size of the light source that it can measure.
Half Brightness Angle
Luminous intensity, half brightness angle
Half-brightness angle, sometimes also called glow angle, is one of the quantities that helps describe a light source. This angle indicates how directional or diffuse the light source is. It is defined as the angle of the light cone at which the luminous intensity of the source is equal to half its maximum intensity. In the example in the figure, the maximum luminous intensity of the source is 200 cd. Let's try to determine the half-brightness angle using this graph. Half the luminous intensity of the source is 100 cd. The angle at which the luminous intensity of the beam reaches 100 cd., that is, the angle of half brightness, is equal to 60 + 60 = 120 ° on the graph (half the angle is depicted in yellow). For two light sources with the same total amount of light, a narrower half-brightness angle means that its luminous intensity is greater, compared to the second source, for angles between 0° and the half-brightness angle. That is, directional sources have a narrower half-brightness angle.
Liquid Image diving mask with attached underwater lights
There are advantages to both wide and narrow half-bright angles, and which one you should prefer depends on the application of the light source. For example, for scuba diving, you should choose a flashlight with a narrow angle of half brightness if there is good visibility in the water. If visibility is poor, then there is no point in using such a flashlight, since it only wastes energy. In this case, a flashlight with a wide angle of half brightness, which diffuses the light well, is a better choice. Also, such a flashlight will help during photo and video shooting, because it illuminates a wider area in front of the camera. Some dive lights can be manually adjusted to half brightness, which is useful since divers can't always predict what the visibility will be like where they're diving.
Illumination standards
Sanitary rules SanPiN 2.2.1/2.1.1.1278-03 regulate the average illumination of buildings, structures and institutions for various purposes, as well as the illumination of stations, roads, pedestrian crossings, parks and stadiums.
The standards for artificial lighting in residential premises are as follows:
- study – 300 lux;
- children's room – 200 lux;
- living rooms and kitchen – 150 lux;
- dressing room – 75 lux;
- bathroom and bath – 50 lux;
- corridor – 50 lux;
- pantry – 30 lux.
However, in most cases, the illumination of rooms and living areas is selected based on the personal preferences of the residents themselves, and adherence to standards is carried out only in relation to production and work premises.
As conclusions, it is worth remembering the following:
- The numerical value of the luminous flux is indicated on the packaging of the lighting product in lumens.
- To obtain the illumination value in lux, it must be divided by the value of the area that needs to be illuminated, expressed in square meters. meters.
- There are sanitary standards for lighting in any type of room.
- The most economical and efficient in terms of light output are light-emitting diode (LED) lamps.